Itching to get your hands dirty in the garden? USDA releases new Plant Hardiness Zone Map
For the first time since 2012, a new Plant Hardiness Zone Map has been released by the U.S. Department of Agriculture.
The map, released Nov. 15, 2023, is a tool used by gardeners and growers around the U.S. to determine which plants are most likely to thrive at a precise location.
Here's what you should know about the new map and Florida zones.
Who created the new plant zones map?
The new map was developed by USDA's Agricultural Research Service and Oregon State University's PRISM Climate Group.
Florida plant zone map: Find your hardiness zone
The USDA's website allows you find your plant hardiness zone based on your exact address.
Enter your zip code and then zoom in to find your home or location to determine your zone.
How do you read the USDA Plant Hardiness Zone Map?
The Plant Hardiness Zone Map is based on the average annual extreme minimum winter temperature, displayed as 10-degree zones ranging from zone 1 (the coldest) to zone 13 (the warmest).
Zone numbers are typically listed with the descriptions of perennial plants in catalogs and other sales information produced by commercial nurseries, plant suppliers, etc.
How do you use the hardiness zone map to grow plants in Florida?
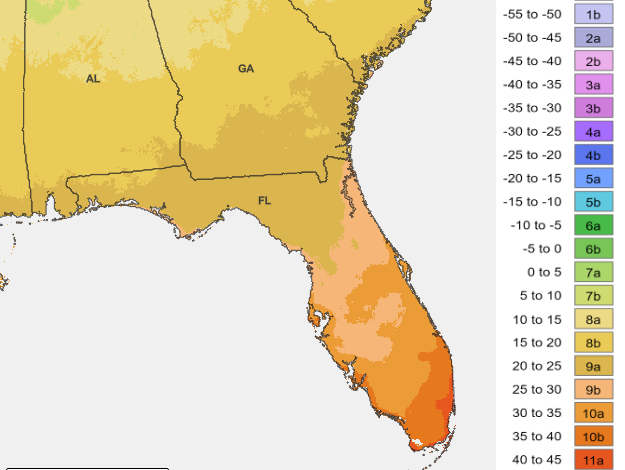
Plant hardiness zones across Florida range from 8B to 11A. The general breakdown is:
Southeast and South Florida: 11A and 10B.
East Coast, along with Central and Southwest Florida: 9B to 10B.
North Florida: 9A or 9B.
Panhandle: 9A or 8B.
All Plant Hardiness Zone Maps are designed as general guides for growing perennial plants.
They are based on the average lowest temperatures, not the lowest ever.
Zones in the 2023 map are based on weather data collected between 1991 and 2020.
The temperatures collected are not the coldest it has ever been or ever will be in an area. Instead, it's the average lowest winter temperatures for a given location for the 30-year span.
How were the new plant zones determined?
The 2023 map is based on 30-year averages of the lowest annual winter temperatures — known as extreme minimum winter temperatures — at specific locations. It's divided into 10-degree Fahrenheit zones and further divided into 5-degree Fahrenheit half-zones.
Like the 2012 map — the last time the map was updated — the 2023 web version offers a Geographic Information System-based interactive format and is designed to be user-friendly.
The 2023 map uses data measured at 13,412 weather stations from 1991 to 2020. In comparison, the 2012 map used data from 7,983 weather stations.
Plant zones across US and Florida
As with the 2012 map, the new version has 13 zones across the United States and its territories.
Each zone is broken into half zones, designated as “A” and “B.”
When compared to the 2012 map, the 2023 version shifted about half of the country to the next warmer half zone. The other half of the country remained in the same half zone.
The shift to the next warmer half zone means those areas warmed somewhere in the range of 0 to 5 degrees Fahrenheit.
However, the USDA noted that while some locations were up to 5 degrees warmer, they did not move into a new half zone.
Overall, the 2023 map is generally about one quarter-zone warmer than reported in the 2012 map throughout much of the United States, as a result of a more recent averaging period (1976-2005 vs. 1991-2020).
Some of the changes in the zones were the results of additional sources and improved data methods.
Are the plant zone changes due to climate change?
Some changes in boundaries are the result of using increasingly sophisticated mapping methods and the inclusion of data from more weather stations.
Temperature updates to plant hardiness zones are not necessarily reflective of global climate change because of the variable nature of the extreme minimum temperature of the year.
Climate changes are usually based on trends in overall annual average temperatures recorded over 50 to 100 years.
The USDA Plant Hardiness Zone Map represents 30-year averages of what are essentially extreme weather events (the coldest temperature of the year), changes in zones are not reliable evidence of whether there has been global warming.
This article originally appeared on Treasure Coast Newspapers: Plant zone hardiness map: 2023 changes released usda
