Can IVE Group Limited’s (ASX:IGL) ROE Continue To Surpass The Industry Average?

Many investors are still learning about the various metrics that can be useful when analysing a stock. This article is for those who would like to learn about Return On Equity (ROE). We’ll use ROE to examine IVE Group Limited (ASX:IGL), by way of a worked example.
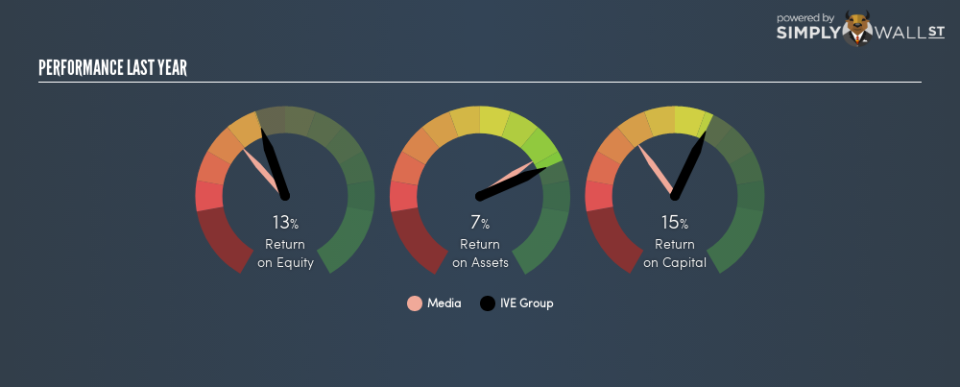
IVE Group has a ROE of 13%, based on the last twelve months. Another way to think of that is that for every A$1 worth of equity in the company, it was able to earn A$0.13.
See our latest analysis for IVE Group
Want to help shape the future of investing tools and platforms? Take the survey and be part of one of the most advanced studies of stock market investors to date.
How Do I Calculate Return On Equity?
The formula for return on equity is:
Return on Equity = Net Profit ÷ Shareholders’ Equity
Or for IVE Group:
13% = 25.715 ÷ AU$199m (Based on the trailing twelve months to June 2018.)
It’s easy to understand the ‘net profit’ part of that equation, but ‘shareholders’ equity’ requires further explanation. It is all the money paid into the company from shareholders, plus any earnings retained. The easiest way to calculate shareholders’ equity is to subtract the company’s total liabilities from the total assets.
What Does Return On Equity Mean?
ROE measures a company’s profitability against the profit it retains, and any outside investments. The ‘return’ is the profit over the last twelve months. That means that the higher the ROE, the more profitable the company is. So, as a general rule, a high ROE is a good thing. Clearly, then, one can use ROE to compare different companies.
Does IVE Group Have A Good Return On Equity?
One simple way to determine if a company has a good return on equity is to compare it to the average for its industry. The limitation of this approach is that some companies are quite different from others, even within the same industry classification. Pleasingly, IVE Group has a superior ROE than the average (9.3%) company in the Media industry.
That is a good sign. In my book, a high ROE almost always warrants a closer look. For example you might check if insiders are buying shares.
How Does Debt Impact ROE?
Virtually all companies need money to invest in the business, to grow profits. That cash can come from retained earnings, issuing new shares (equity), or debt. In the case of the first and second options, the ROE will reflect this use of cash, for growth. In the latter case, the debt required for growth will boost returns, but will not impact the shareholders’ equity. Thus the use of debt can improve ROE, albeit along with extra risk in the case of stormy weather, metaphorically speaking.
IVE Group’s Debt And Its 13% ROE
While IVE Group does have some debt, with debt to equity of just 0.76, we wouldn’t say debt is excessive. The fact that it achieved a fairly good ROE with only modest debt suggests the business might be worth putting on your watchlist. Careful use of debt to boost returns is often very good for shareholders. However, it could reduce the company’s ability to take advantage of future opportunities.
In Summary
Return on equity is useful for comparing the quality of different businesses. In my book the highest quality companies have high return on equity, despite low debt. If two companies have around the same level of debt to equity, and one has a higher ROE, I’d generally prefer the one with higher ROE.
Having said that, while ROE is a useful indicator of business quality, you’ll have to look at a whole range of factors to determine the right price to buy a stock. Profit growth rates, versus the expectations reflected in the price of the stock, are a particularly important to consider. So I think it may be worth checking this free report on analyst forecasts for the company.
Of course IVE Group may not be the best stock to buy. So you may wish to see this free collection of other companies that have high ROE and low debt.
To help readers see past the short term volatility of the financial market, we aim to bring you a long-term focused research analysis purely driven by fundamental data. Note that our analysis does not factor in the latest price-sensitive company announcements.
The author is an independent contributor and at the time of publication had no position in the stocks mentioned. For errors that warrant correction please contact the editor at editorial-team@simplywallst.com.

