J. Smart (Contractors) (LON:SMJ) Seems To Use Debt Quite Sensibly

Legendary fund manager Li Lu (who Charlie Munger backed) once said, 'The biggest investment risk is not the volatility of prices, but whether you will suffer a permanent loss of capital.' So it seems the smart money knows that debt - which is usually involved in bankruptcies - is a very important factor, when you assess how risky a company is. We note that J. Smart & Co. (Contractors) PLC (LON:SMJ) does have debt on its balance sheet. But the more important question is: how much risk is that debt creating?
When Is Debt Dangerous?
Debt assists a business until the business has trouble paying it off, either with new capital or with free cash flow. In the worst case scenario, a company can go bankrupt if it cannot pay its creditors. However, a more common (but still painful) scenario is that it has to raise new equity capital at a low price, thus permanently diluting shareholders. Of course, plenty of companies use debt to fund growth, without any negative consequences. When we think about a company's use of debt, we first look at cash and debt together.
View our latest analysis for J. Smart (Contractors)
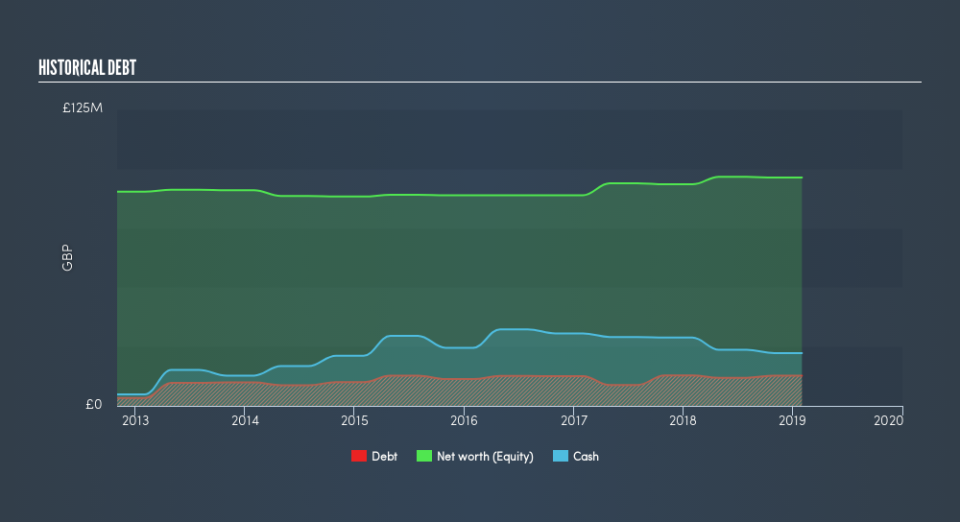
How Much Debt Does J. Smart (Contractors) Carry?
The chart below, which you can click on for greater detail, shows that J. Smart (Contractors) had UK£12.7m in debt in January 2019; about the same as the year before. But it also has UK£22.3m in cash to offset that, meaning it has UK£9.55m net cash.
How Strong Is J. Smart (Contractors)'s Balance Sheet?
According to the last reported balance sheet, J. Smart (Contractors) had liabilities of UK£17.5m due within 12 months, and liabilities of UK£2.00m due beyond 12 months. Offsetting this, it had UK£22.3m in cash and UK£4.45m in receivables that were due within 12 months. So it can boast UK£7.26m more liquid assets than total liabilities.
This surplus suggests that J. Smart (Contractors) has a conservative balance sheet, and could probably eliminate its debt without much difficulty. Simply put, the fact that J. Smart (Contractors) has more cash than debt is arguably a good indication that it can manage its debt safely.
In fact J. Smart (Contractors)'s saving grace is its low debt levels, because its EBIT has tanked 48% in the last twelve months. When it comes to paying off debt, falling earnings are no more useful than sugary sodas are for your health. The balance sheet is clearly the area to focus on when you are analysing debt. But you can't view debt in total isolation; since J. Smart (Contractors) will need earnings to service that debt. So if you're keen to discover more about its earnings, it might be worth checking out this graph of its long term earnings trend.
But our final consideration is also important, because a company cannot pay debt with paper profits; it needs cold hard cash. While J. Smart (Contractors) has net cash on its balance sheet, it's still worth taking a look at its ability to convert earnings before interest and tax (EBIT) to free cash flow, to help us understand how quickly it is building (or eroding) that cash balance. Looking at the most recent three years, J. Smart (Contractors) recorded free cash flow of 22% of its EBIT, which is weaker than we'd expect. That weak cash conversion makes it more difficult to handle indebtedness.
Summing up
While we empathize with investors who find debt concerning, you should keep in mind that J. Smart (Contractors) has net cash of UK£9.5m, as well as more liquid assets than liabilities. So we are not troubled with J. Smart (Contractors)'s debt use. Over time, share prices tend to follow earnings per share, so if you're interested in J. Smart (Contractors), you may well want to click here to check an interactive graph of its earnings per share history.
If you're interested in investing in businesses that can grow profits without the burden of debt, then check out this free list of growing businesses that have net cash on the balance sheet.
We aim to bring you long-term focused research analysis driven by fundamental data. Note that our analysis may not factor in the latest price-sensitive company announcements or qualitative material.
If you spot an error that warrants correction, please contact the editor at editorial-team@simplywallst.com. This article by Simply Wall St is general in nature. It does not constitute a recommendation to buy or sell any stock, and does not take account of your objectives, or your financial situation. Simply Wall St has no position in the stocks mentioned. Thank you for reading.
