What Is Jash Engineering's (NSE:JASH) P/E Ratio After Its Share Price Rocketed?

It's really great to see that even after a strong run, Jash Engineering (NSE:JASH) shares have been powering on, with a gain of 32% in the last thirty days. The full year gain of 32% is pretty reasonable, too.
All else being equal, a sharp share price increase should make a stock less attractive to potential investors. While the market sentiment towards a stock is very changeable, in the long run, the share price will tend to move in the same direction as earnings per share. The implication here is that deep value investors might steer clear when expectations of a company are too high. One way to gauge market expectations of a stock is to look at its Price to Earnings Ratio (PE Ratio). A high P/E implies that investors have high expectations of what a company can achieve compared to a company with a low P/E ratio.
View our latest analysis for Jash Engineering
How Does Jash Engineering's P/E Ratio Compare To Its Peers?
Jash Engineering's P/E of 13.82 indicates some degree of optimism towards the stock. The image below shows that Jash Engineering has a higher P/E than the average (12.6) P/E for companies in the machinery industry.
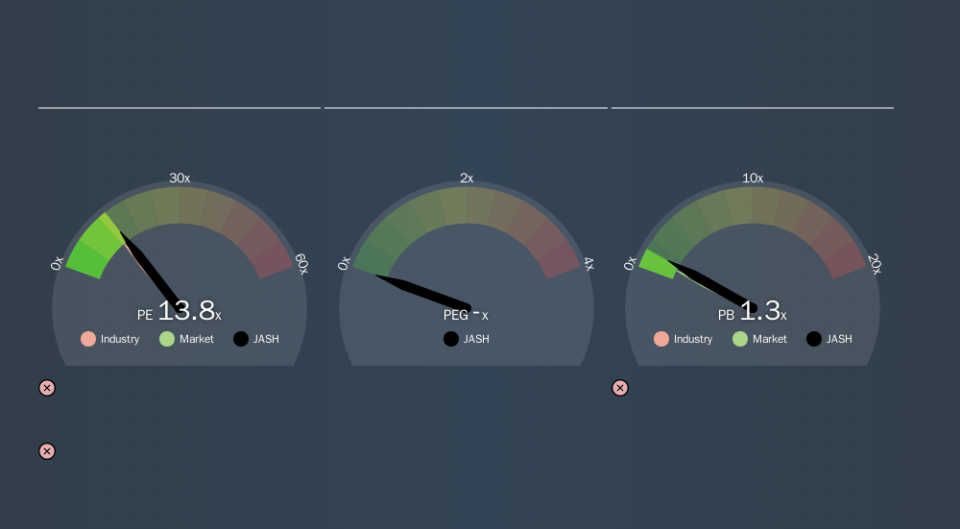
That means that the market expects Jash Engineering will outperform other companies in its industry. The market is optimistic about the future, but that doesn't guarantee future growth. So further research is always essential. I often monitor director buying and selling.
How Growth Rates Impact P/E Ratios
Companies that shrink earnings per share quickly will rapidly decrease the 'E' in the equation. Therefore, even if you pay a low multiple of earnings now, that multiple will become higher in the future. So while a stock may look cheap based on past earnings, it could be expensive based on future earnings.
In the last year, Jash Engineering grew EPS like Taylor Swift grew her fan base back in 2010; the 138% gain was both fast and well deserved. Regrettably, the longer term performance is poor, with EPS down -2.4% per year over 3 years.
Remember: P/E Ratios Don't Consider The Balance Sheet
Don't forget that the P/E ratio considers market capitalization. Thus, the metric does not reflect cash or debt held by the company. Theoretically, a business can improve its earnings (and produce a lower P/E in the future) by investing in growth. That means taking on debt (or spending its cash).
Spending on growth might be good or bad a few years later, but the point is that the P/E ratio does not account for the option (or lack thereof).
Jash Engineering's Balance Sheet
Jash Engineering's net debt equates to 31% of its market capitalization. While it's worth keeping this in mind, it isn't a worry.
The Bottom Line On Jash Engineering's P/E Ratio
Jash Engineering's P/E is 13.8 which is about average (13.4) in the IN market. When you consider the impressive EPS growth last year (along with some debt), it seems the market has questions about whether rapid EPS growth will be sustained. What we know for sure is that investors have become more excited about Jash Engineering recently, since they have pushed its P/E ratio from 10.5 to 13.8 over the last month. If you like to buy stocks that have recently impressed the market, then this one might be a candidate; but if you prefer to invest when there is 'blood in the streets', then you may feel the opportunity has passed.
Investors should be looking to buy stocks that the market is wrong about. If the reality for a company is better than it expects, you can make money by buying and holding for the long term. Although we don't have analyst forecasts you might want to assess this data-rich visualization of earnings, revenue and cash flow.
You might be able to find a better buy than Jash Engineering. If you want a selection of possible winners, check out this free list of interesting companies that trade on a P/E below 20 (but have proven they can grow earnings).
We aim to bring you long-term focused research analysis driven by fundamental data. Note that our analysis may not factor in the latest price-sensitive company announcements or qualitative material.
If you spot an error that warrants correction, please contact the editor at editorial-team@simplywallst.com. This article by Simply Wall St is general in nature. It does not constitute a recommendation to buy or sell any stock, and does not take account of your objectives, or your financial situation. Simply Wall St has no position in the stocks mentioned. Thank you for reading.
