Is Jewett-Cameron Trading Company Ltd. (NASDAQ:JCTC.F) Investing Effectively In Its Business?

Today we'll look at Jewett-Cameron Trading Company Ltd. (NASDAQ:JCTC.F) and reflect on its potential as an investment. To be precise, we'll consider its Return On Capital Employed (ROCE), as that will inform our view of the quality of the business.
First of all, we'll work out how to calculate ROCE. Then we'll compare its ROCE to similar companies. Finally, we'll look at how its current liabilities affect its ROCE.
Return On Capital Employed (ROCE): What is it?
ROCE is a metric for evaluating how much pre-tax income (in percentage terms) a company earns on the capital invested in its business. In general, businesses with a higher ROCE are usually better quality. Overall, it is a valuable metric that has its flaws. Author Edwin Whiting says to be careful when comparing the ROCE of different businesses, since 'No two businesses are exactly alike.
So, How Do We Calculate ROCE?
Analysts use this formula to calculate return on capital employed:
Return on Capital Employed = Earnings Before Interest and Tax (EBIT) ÷ (Total Assets - Current Liabilities)
Or for Jewett-Cameron Trading:
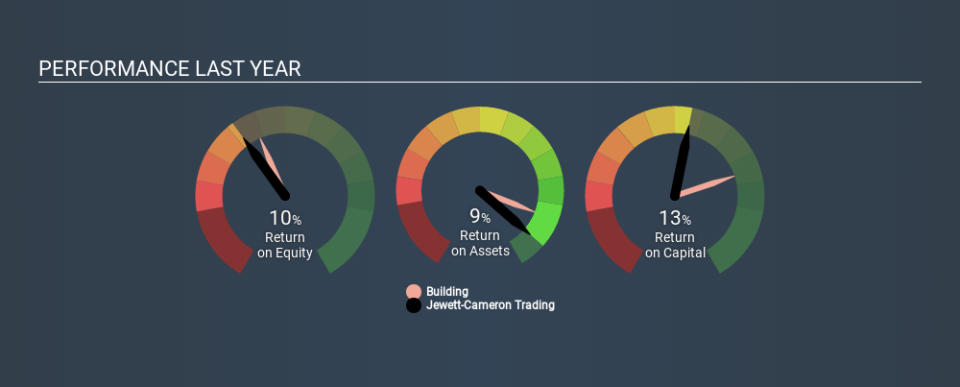
0.13 = US$2.7m ÷ (US$22m - US$1.7m) (Based on the trailing twelve months to August 2019.)
So, Jewett-Cameron Trading has an ROCE of 13%.
Check out our latest analysis for Jewett-Cameron Trading
Does Jewett-Cameron Trading Have A Good ROCE?
One way to assess ROCE is to compare similar companies. Using our data, Jewett-Cameron Trading's ROCE appears to be around the 13% average of the Building industry. Separate from Jewett-Cameron Trading's performance relative to its industry, its ROCE in absolute terms looks satisfactory, and it may be worth researching in more depth.
Jewett-Cameron Trading's current ROCE of 13% is lower than its ROCE in the past, which was 21%, 3 years ago. Therefore we wonder if the company is facing new headwinds. The image below shows how Jewett-Cameron Trading's ROCE compares to its industry, and you can click it to see more detail on its past growth.
Remember that this metric is backwards looking - it shows what has happened in the past, and does not accurately predict the future. ROCE can be deceptive for cyclical businesses, as returns can look incredible in boom times, and terribly low in downturns. ROCE is, after all, simply a snap shot of a single year. If Jewett-Cameron Trading is cyclical, it could make sense to check out this free graph of past earnings, revenue and cash flow.
How Jewett-Cameron Trading's Current Liabilities Impact Its ROCE
Current liabilities are short term bills and invoices that need to be paid in 12 months or less. Due to the way ROCE is calculated, a high level of current liabilities makes a company look as though it has less capital employed, and thus can (sometimes unfairly) boost the ROCE. To check the impact of this, we calculate if a company has high current liabilities relative to its total assets.
Jewett-Cameron Trading has total liabilities of US$1.7m and total assets of US$22m. Therefore its current liabilities are equivalent to approximately 7.8% of its total assets. Low current liabilities have only a minimal impact on Jewett-Cameron Trading's ROCE, making its decent returns more credible.
What We Can Learn From Jewett-Cameron Trading's ROCE
If it is able to keep this up, Jewett-Cameron Trading could be attractive. Jewett-Cameron Trading shapes up well under this analysis, but it is far from the only business delivering excellent numbers . You might also want to check this free collection of companies delivering excellent earnings growth.
If you like to buy stocks alongside management, then you might just love this free list of companies. (Hint: insiders have been buying them).
If you spot an error that warrants correction, please contact the editor at editorial-team@simplywallst.com. This article by Simply Wall St is general in nature. It does not constitute a recommendation to buy or sell any stock, and does not take account of your objectives, or your financial situation. Simply Wall St has no position in the stocks mentioned.
We aim to bring you long-term focused research analysis driven by fundamental data. Note that our analysis may not factor in the latest price-sensitive company announcements or qualitative material. Thank you for reading.
