Do You Like Jingrui Holdings Limited (HKG:1862) At This P/E Ratio?

Want to participate in a short research study? Help shape the future of investing tools and you could win a $250 gift card!
This article is written for those who want to get better at using price to earnings ratios (P/E ratios). To keep it practical, we'll show how Jingrui Holdings Limited's (HKG:1862) P/E ratio could help you assess the value on offer. Based on the last twelve months, Jingrui Holdings's P/E ratio is 2.31. In other words, at today's prices, investors are paying HK$2.31 for every HK$1 in prior year profit.
Check out our latest analysis for Jingrui Holdings
How Do I Calculate A Price To Earnings Ratio?
The formula for price to earnings is:
Price to Earnings Ratio = Share Price (in reporting currency) ÷ Earnings per Share (EPS)
Or for Jingrui Holdings:
P/E of 2.31 = CN¥1.78 (Note: this is the share price in the reporting currency, namely, CNY ) ÷ CN¥0.77 (Based on the trailing twelve months to December 2018.)
Is A High P/E Ratio Good?
A higher P/E ratio implies that investors pay a higher price for the earning power of the business. All else being equal, it's better to pay a low price -- but as Warren Buffett said, 'It's far better to buy a wonderful company at a fair price than a fair company at a wonderful price.'
How Growth Rates Impact P/E Ratios
Generally speaking the rate of earnings growth has a profound impact on a company's P/E multiple. That's because companies that grow earnings per share quickly will rapidly increase the 'E' in the equation. And in that case, the P/E ratio itself will drop rather quickly. Then, a lower P/E should attract more buyers, pushing the share price up.
Most would be impressed by Jingrui Holdings earnings growth of 23% in the last year. And its annual EPS growth rate over 5 years is 9.9%. So one might expect an above average P/E ratio.
How Does Jingrui Holdings's P/E Ratio Compare To Its Peers?
The P/E ratio essentially measures market expectations of a company. If you look at the image below, you can see Jingrui Holdings has a lower P/E than the average (6.3) in the real estate industry classification.
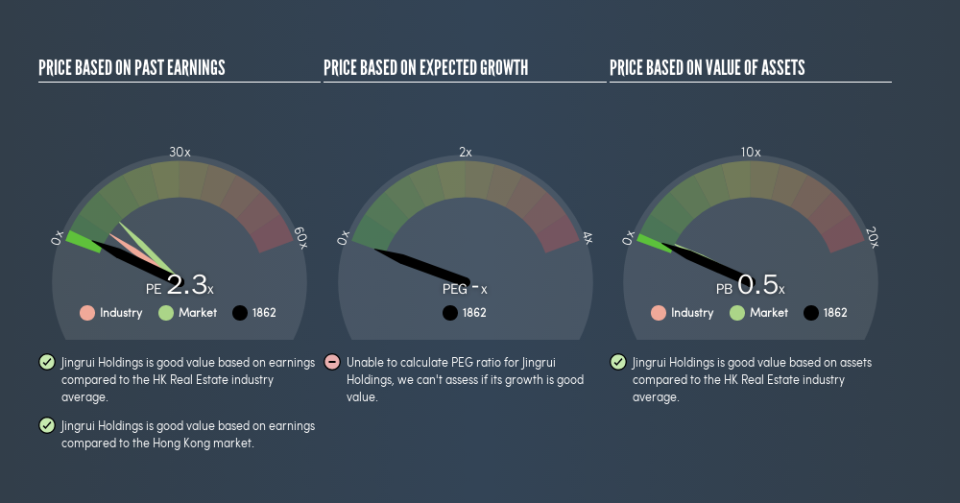
Its relatively low P/E ratio indicates that Jingrui Holdings shareholders think it will struggle to do as well as other companies in its industry classification. Many investors like to buy stocks when the market is pessimistic about their prospects. It is arguably worth checking if insiders are buying shares, because that might imply they believe the stock is undervalued.
Don't Forget: The P/E Does Not Account For Debt or Bank Deposits
It's important to note that the P/E ratio considers the market capitalization, not the enterprise value. That means it doesn't take debt or cash into account. Hypothetically, a company could reduce its future P/E ratio by spending its cash (or taking on debt) to achieve higher earnings.
Such spending might be good or bad, overall, but the key point here is that you need to look at debt to understand the P/E ratio in context.
How Does Jingrui Holdings's Debt Impact Its P/E Ratio?
Jingrui Holdings's net debt is considerable, at 323% of its market cap. If you want to compare its P/E ratio to other companies, you must keep in mind that these debt levels would usually warrant a relatively low P/E.
The Verdict On Jingrui Holdings's P/E Ratio
Jingrui Holdings trades on a P/E ratio of 2.3, which is below the HK market average of 10.7. The company has a meaningful amount of debt on the balance sheet, but that should not eclipse the solid earnings growth. If it continues to grow, then the current low P/E may prove to be unjustified.
Investors have an opportunity when market expectations about a stock are wrong. If it is underestimating a company, investors can make money by buying and holding the shares until the market corrects itself. We don't have analyst forecasts, but you might want to assess this data-rich visualization of earnings, revenue and cash flow.
Of course, you might find a fantastic investment by looking at a few good candidates. So take a peek at this free list of companies with modest (or no) debt, trading on a P/E below 20.
We aim to bring you long-term focused research analysis driven by fundamental data. Note that our analysis may not factor in the latest price-sensitive company announcements or qualitative material.
If you spot an error that warrants correction, please contact the editor at editorial-team@simplywallst.com. This article by Simply Wall St is general in nature. It does not constitute a recommendation to buy or sell any stock, and does not take account of your objectives, or your financial situation. Simply Wall St has no position in the stocks mentioned. Thank you for reading.

