Johns Lyng Group (ASX:JLG) Shareholders Have Enjoyed An Impressive 198% Share Price Gain
- Oops!Something went wrong.Please try again later.
The most you can lose on any stock (assuming you don't use leverage) is 100% of your money. But when you pick a company that is really flourishing, you can make more than 100%. For example, the Johns Lyng Group Limited (ASX:JLG) share price has soared 198% in the last three years. That sort of return is as solid as granite. Also pleasing for shareholders was the 22% gain in the last three months.
View our latest analysis for Johns Lyng Group
While markets are a powerful pricing mechanism, share prices reflect investor sentiment, not just underlying business performance. One flawed but reasonable way to assess how sentiment around a company has changed is to compare the earnings per share (EPS) with the share price.
During three years of share price growth, Johns Lyng Group achieved compound earnings per share growth of 0.2% per year. This EPS growth is lower than the 44% average annual increase in the share price. So it's fair to assume the market has a higher opinion of the business than it did three years ago. It's not unusual to see the market 're-rate' a stock, after a few years of growth. This optimism is also reflected in the fairly generous P/E ratio of 49.60.
The company's earnings per share (over time) is depicted in the image below (click to see the exact numbers).
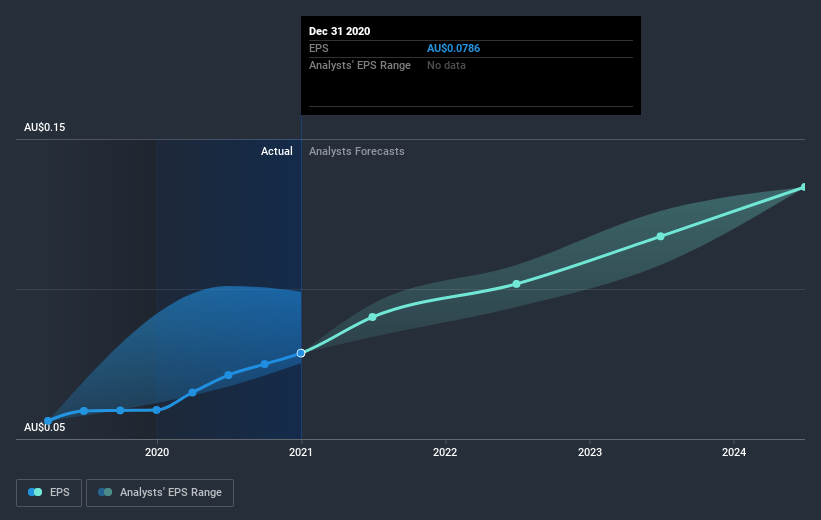
We know that Johns Lyng Group has improved its bottom line lately, but is it going to grow revenue? If you're interested, you could check this free report showing consensus revenue forecasts.
What About Dividends?
When looking at investment returns, it is important to consider the difference between total shareholder return (TSR) and share price return. Whereas the share price return only reflects the change in the share price, the TSR includes the value of dividends (assuming they were reinvested) and the benefit of any discounted capital raising or spin-off. It's fair to say that the TSR gives a more complete picture for stocks that pay a dividend. We note that for Johns Lyng Group the TSR over the last 3 years was 216%, which is better than the share price return mentioned above. The dividends paid by the company have thusly boosted the total shareholder return.
A Different Perspective
Pleasingly, Johns Lyng Group's total shareholder return last year was 71%. That's including the dividend. That gain actually surpasses the 47% TSR it generated (per year) over three years. Given the track record of solid returns over varying time frames, it might be worth putting Johns Lyng Group on your watchlist. Before spending more time on Johns Lyng Group it might be wise to click here to see if insiders have been buying or selling shares.
We will like Johns Lyng Group better if we see some big insider buys. While we wait, check out this free list of growing companies with considerable, recent, insider buying.
Please note, the market returns quoted in this article reflect the market weighted average returns of stocks that currently trade on AU exchanges.
This article by Simply Wall St is general in nature. It does not constitute a recommendation to buy or sell any stock, and does not take account of your objectives, or your financial situation. We aim to bring you long-term focused analysis driven by fundamental data. Note that our analysis may not factor in the latest price-sensitive company announcements or qualitative material. Simply Wall St has no position in any stocks mentioned.
Have feedback on this article? Concerned about the content? Get in touch with us directly. Alternatively, email editorial-team (at) simplywallst.com.
