JSW Energy Limited (NSE:JSWENERGY) Earns A Nice Return On Capital Employed

Today we'll evaluate JSW Energy Limited (NSE:JSWENERGY) to determine whether it could have potential as an investment idea. In particular, we'll consider its Return On Capital Employed (ROCE), as that can give us insight into how profitably the company is able to employ capital in its business.
First up, we'll look at what ROCE is and how we calculate it. Then we'll compare its ROCE to similar companies. And finally, we'll look at how its current liabilities are impacting its ROCE.
What is Return On Capital Employed (ROCE)?
ROCE measures the amount of pre-tax profits a company can generate from the capital employed in its business. All else being equal, a better business will have a higher ROCE. Ultimately, it is a useful but imperfect metric. Renowned investment researcher Michael Mauboussin has suggested that a high ROCE can indicate that 'one dollar invested in the company generates value of more than one dollar'.
So, How Do We Calculate ROCE?
Analysts use this formula to calculate return on capital employed:
Return on Capital Employed = Earnings Before Interest and Tax (EBIT) ÷ (Total Assets - Current Liabilities)
Or for JSW Energy:
0.08 = ₹17b ÷ (₹259b - ₹43b) (Based on the trailing twelve months to June 2019.)
Therefore, JSW Energy has an ROCE of 8.0%.
Check out our latest analysis for JSW Energy
Does JSW Energy Have A Good ROCE?
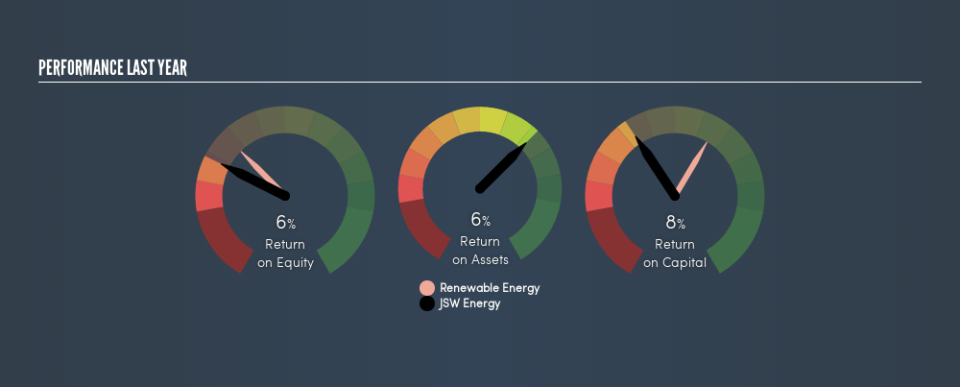
When making comparisons between similar businesses, investors may find ROCE useful. Using our data, we find that JSW Energy's ROCE is meaningfully better than the 6.6% average in the Renewable Energy industry. I think that's good to see, since it implies the company is better than other companies at making the most of its capital. Regardless of how JSW Energy stacks up against its industry, its ROCE in absolute terms is quite low (especially compared to a bank account). It is likely that there are more attractive prospects out there.
JSW Energy's current ROCE of 8.0% is lower than 3 years ago, when the company reported a 16% ROCE. Therefore we wonder if the company is facing new headwinds. You can see in the image below how JSW Energy's ROCE compares to its industry. Click to see more on past growth.
When considering ROCE, bear in mind that it reflects the past and does not necessarily predict the future. ROCE can be misleading for companies in cyclical industries, with returns looking impressive during the boom times, but very weak during the busts. ROCE is, after all, simply a snap shot of a single year. Since the future is so important for investors, you should check out our free report on analyst forecasts for JSW Energy.
JSW Energy's Current Liabilities And Their Impact On Its ROCE
Current liabilities include invoices, such as supplier payments, short-term debt, or a tax bill, that need to be paid within 12 months. Due to the way the ROCE equation works, having large bills due in the near term can make it look as though a company has less capital employed, and thus a higher ROCE than usual. To counteract this, we check if a company has high current liabilities, relative to its total assets.
JSW Energy has total liabilities of ₹43b and total assets of ₹259b. As a result, its current liabilities are equal to approximately 17% of its total assets. With a very reasonable level of current liabilities, so the impact on ROCE is fairly minimal.
The Bottom Line On JSW Energy's ROCE
While that is good to see, JSW Energy has a low ROCE and does not look attractive in this analysis. You might be able to find a better investment than JSW Energy. If you want a selection of possible winners, check out this free list of interesting companies that trade on a P/E below 20 (but have proven they can grow earnings).
For those who like to find winning investments this free list of growing companies with recent insider purchasing, could be just the ticket.
We aim to bring you long-term focused research analysis driven by fundamental data. Note that our analysis may not factor in the latest price-sensitive company announcements or qualitative material.
If you spot an error that warrants correction, please contact the editor at editorial-team@simplywallst.com. This article by Simply Wall St is general in nature. It does not constitute a recommendation to buy or sell any stock, and does not take account of your objectives, or your financial situation. Simply Wall St has no position in the stocks mentioned. Thank you for reading.
