K2 F&B Holdings (HKG:2108) Seems To Be Using An Awful Lot Of Debt

Legendary fund manager Li Lu (who Charlie Munger backed) once said, 'The biggest investment risk is not the volatility of prices, but whether you will suffer a permanent loss of capital. So it seems the smart money knows that debt - which is usually involved in bankruptcies - is a very important factor, when you assess how risky a company is. We note that K2 F&B Holdings Limited (HKG:2108) does have debt on its balance sheet. But the real question is whether this debt is making the company risky.
When Is Debt Dangerous?
Debt assists a business until the business has trouble paying it off, either with new capital or with free cash flow. In the worst case scenario, a company can go bankrupt if it cannot pay its creditors. However, a more usual (but still expensive) situation is where a company must dilute shareholders at a cheap share price simply to get debt under control. Of course, debt can be an important tool in businesses, particularly capital heavy businesses. The first thing to do when considering how much debt a business uses is to look at its cash and debt together.
See our latest analysis for K2 F&B Holdings
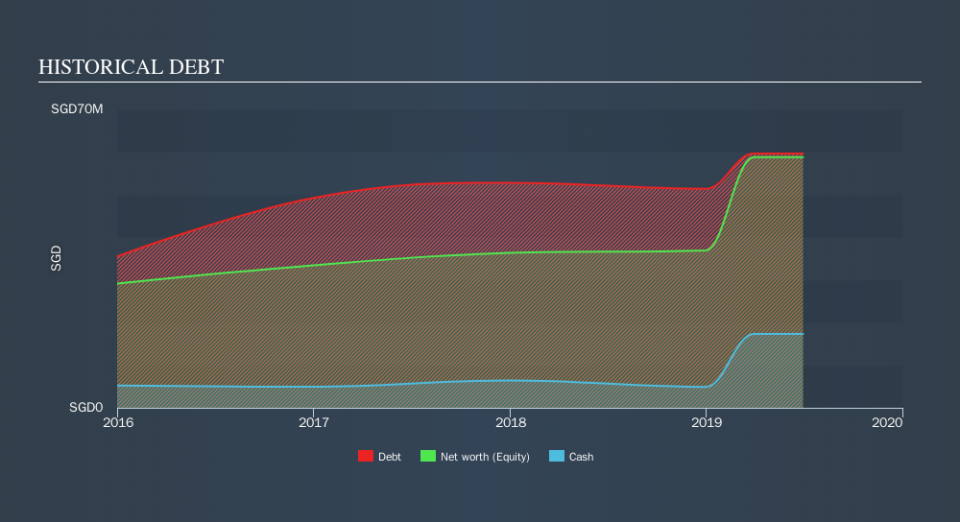
What Is K2 F&B Holdings's Debt?
The image below, which you can click on for greater detail, shows that at June 2019 K2 F&B Holdings had debt of S$59.6m, up from S$52.8m in one year. On the flip side, it has S$17.4m in cash leading to net debt of about S$42.3m.
How Healthy Is K2 F&B Holdings's Balance Sheet?
We can see from the most recent balance sheet that K2 F&B Holdings had liabilities of S$8.09m falling due within a year, and liabilities of S$57.7m due beyond that. Offsetting this, it had S$17.4m in cash and S$257.0k in receivables that were due within 12 months. So its liabilities total S$48.2m more than the combination of its cash and short-term receivables.
When you consider that this deficiency exceeds the company's S$34.9m market capitalization, you might well be inclined to review the balance sheet intently. In the scenario where the company had to clean up its balance sheet quickly, it seems likely shareholders would suffer extensive dilution.
In order to size up a company's debt relative to its earnings, we calculate its net debt divided by its earnings before interest, tax, depreciation, and amortization (EBITDA) and its earnings before interest and tax (EBIT) divided by its interest expense (its interest cover). The advantage of this approach is that we take into account both the absolute quantum of debt (with net debt to EBITDA) and the actual interest expenses associated with that debt (with its interest cover ratio).
K2 F&B Holdings has a rather high debt to EBITDA ratio of 9.0 which suggests a meaningful debt load. However, its interest coverage of 3.7 is reasonably strong, which is a good sign. Worse, K2 F&B Holdings's EBIT was down 28% over the last year. If earnings keep going like that over the long term, it has a snowball's chance in hell of paying off that debt. There's no doubt that we learn most about debt from the balance sheet. But you can't view debt in total isolation; since K2 F&B Holdings will need earnings to service that debt. So if you're keen to discover more about its earnings, it might be worth checking out this graph of its long term earnings trend.
Finally, a business needs free cash flow to pay off debt; accounting profits just don't cut it. So it's worth checking how much of that EBIT is backed by free cash flow. Over the most recent three years, K2 F&B Holdings recorded free cash flow worth 65% of its EBIT, which is around normal, given free cash flow excludes interest and tax. This free cash flow puts the company in a good position to pay down debt, when appropriate.
Our View
To be frank both K2 F&B Holdings's net debt to EBITDA and its track record of (not) growing its EBIT make us rather uncomfortable with its debt levels. But at least it's pretty decent at converting EBIT to free cash flow; that's encouraging. Overall, it seems to us that K2 F&B Holdings's balance sheet is really quite a risk to the business. For this reason we're pretty cautious about the stock, and we think shareholders should keep a close eye on its liquidity. Above most other metrics, we think its important to track how fast earnings per share is growing, if at all. If you've also come to that realization, you're in luck, because today you can view this interactive graph of K2 F&B Holdings's earnings per share history for free.
If you're interested in investing in businesses that can grow profits without the burden of debt, then check out this free list of growing businesses that have net cash on the balance sheet.
We aim to bring you long-term focused research analysis driven by fundamental data. Note that our analysis may not factor in the latest price-sensitive company announcements or qualitative material.
If you spot an error that warrants correction, please contact the editor at editorial-team@simplywallst.com. This article by Simply Wall St is general in nature. It does not constitute a recommendation to buy or sell any stock, and does not take account of your objectives, or your financial situation. Simply Wall St has no position in the stocks mentioned. Thank you for reading.
