Kansas’ drought is getting worse. These maps show what the lack of rain means for KC
As summer wears on, the Midwest is experiencing significant drought conditions caused by abnormally low precipitation and high temperatures. Experts expect these conditions will continue throughout the summer.
Here’s a map of drought conditions in the Midwest, centering on Kansas City. If you can’t see the map below, click here.
While the metro itself is feeling only moderate to severe drought, nearby cities are worse off. Jefferson City is seeing extreme drought, while Wichita and Lincoln, Nebraska are in the most severe category of exceptional drought, according to data from the U.S. drought monitor.
“Significantly below-normal precipitation has been the main driver for the rapid intensification of drought conditions,” the National Integrated Drought Information System (NIDIS) wrote in a June 23 status update. “Drought is likely to persist and potentially expand across the Midwest this summer.”
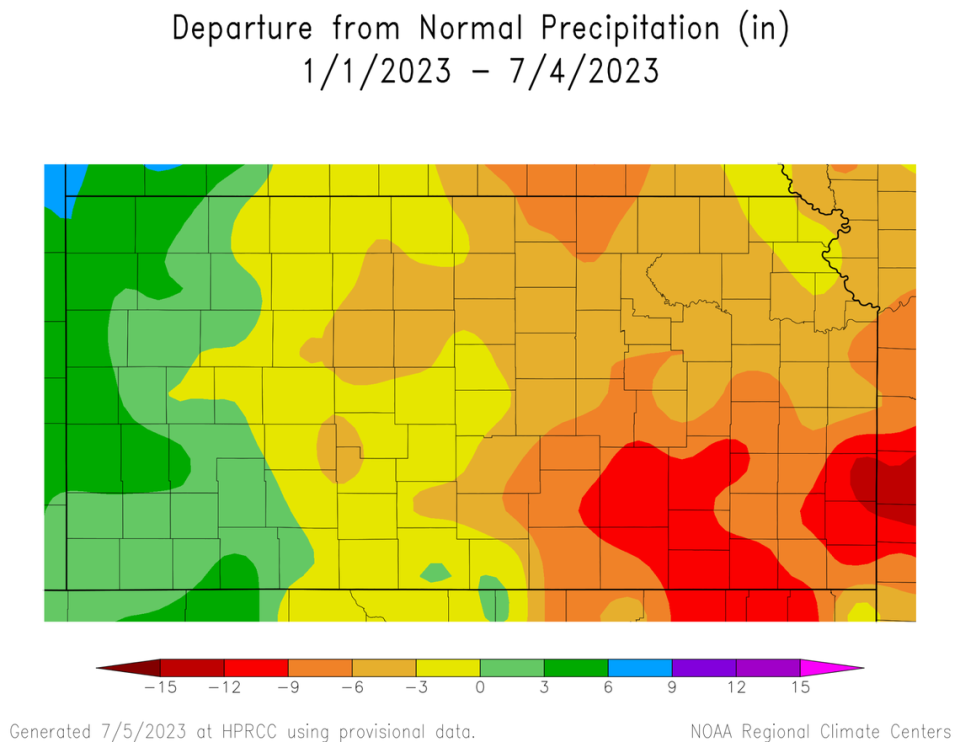
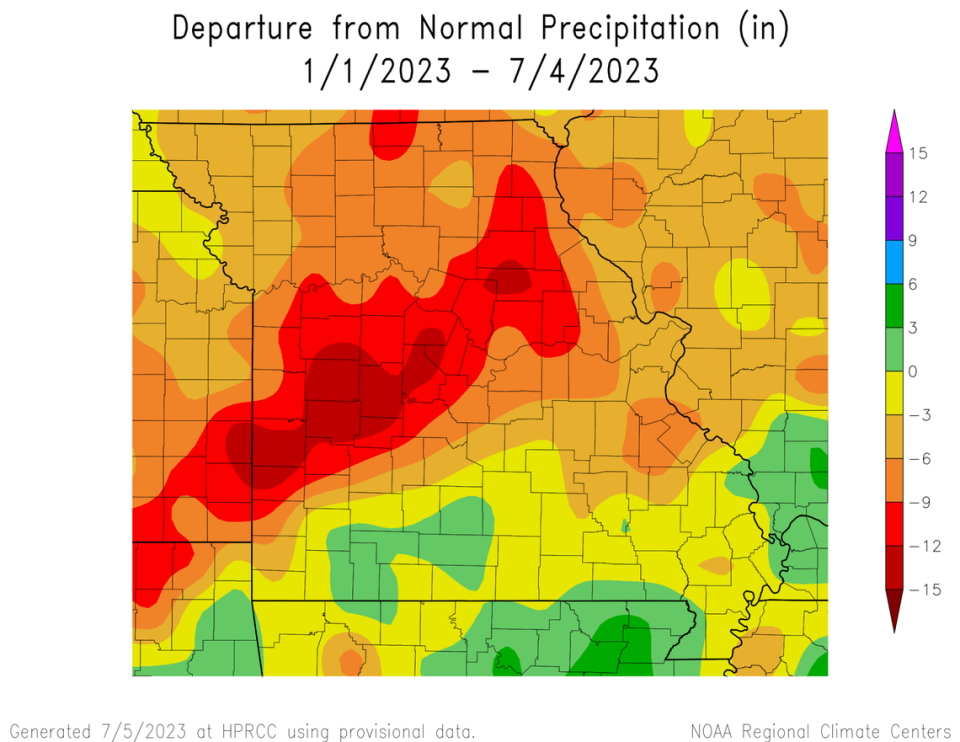
Parts of the metro have experienced between three and 12 inches less rain this year so far than during an average year, according to the High Plains Regional Climate Center. Check out the color-coded maps below to see these rainfall deficits in Kansas and Missouri.
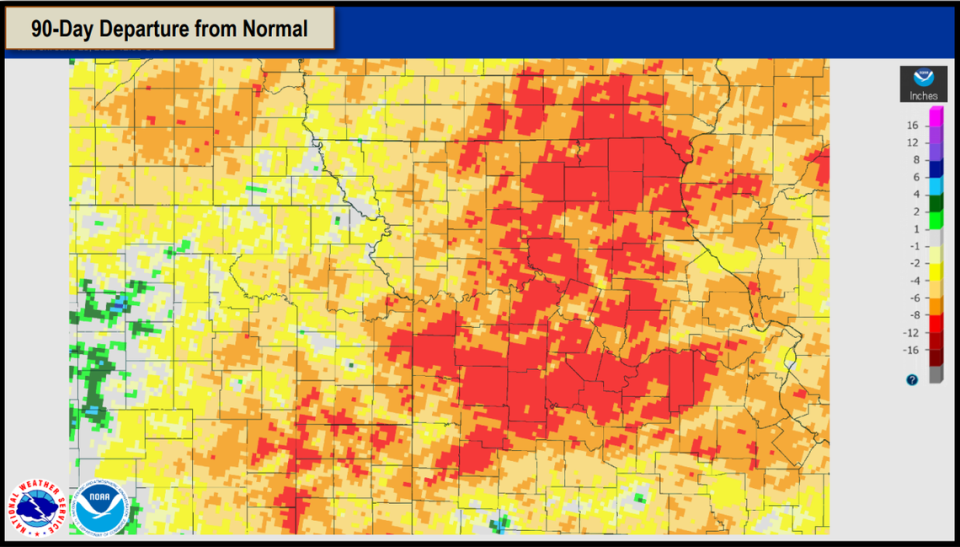
National Weather Service data shows that the past three months have played the largest role in lowering the metro’s rainfall totals.
“In the last 90 days precipitation deficits ranging from 8”-12” have developed across much of central, north central, and northeastern Missouri as well portions of the KC Metro and east central and southeastern Kansas,” a June 29 report states.
Experts expect this low rainfall to lead to low water levels in local rivers as well as very dry soil, which could have an impact on local agriculture.
“If corn-growing areas do not start receiving rainfall now, there will likely be impacts to corn yields, and potentially other crops as well,” the NIDIS wrote. “Water supply for livestock and municipalities in some areas is also a major concern if drought conditions persist.”
Dry conditions don’t just affect agriculture: They can also lead to challenges in urban areas. Dry soil contracting can pull away from underground pipes, causing water main breaks and other utility challenges.
Wildlife can also be impacted — high temperatures and low water flow killed thousands of fish in Brush Creek along the Country Club Plaza last week.
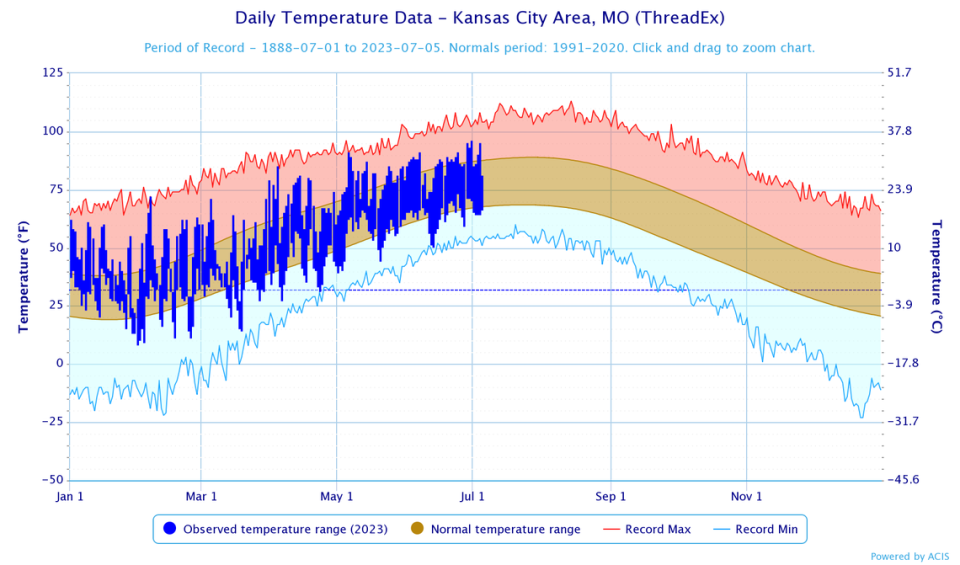
Temperatures have also been slightly high compared to a typical year — Kansas City has already broken one daily heat record, when the high temperature on Monday, Feb. 6 reached 72°. The graph below shows the temperature range each day of the year so far, compared to record highs and lows on that day since data collection began in 1888.
One expert with the Mid-America Regional Council told The Star that the city’s recent sunny conditions and lack of wind are caused by a zone of high air pressure centered over the metro. These conditions are also contributing to high levels of ground level ozone, also known as smog.
So far this year, Kansas City has seen 11 high ozone alert days, compared to only two last year and four in 2021. You can check pollution levels at air quality monitors around the metro on these maps.
Do you have more questions about weather or climate conditions in Kansas City? Ask the Service Journalism team at kcq@kcstar.com.

