Key ETF Indicators Tinged With Gold
The ETF Think Tank is a community of advisors focused on a client-centric approach to investing through the use of ETFs. Each week we disseminate research on the growth of the ETF industry, including key performance indicators (KPIs) on number of ETFs listed, assets, revenue, exchange market share and number of issuers. This data is useful in serving to monitor the trends in the ETF ecosystem. ETF Think Tank produces this monthly report for ETF.com.

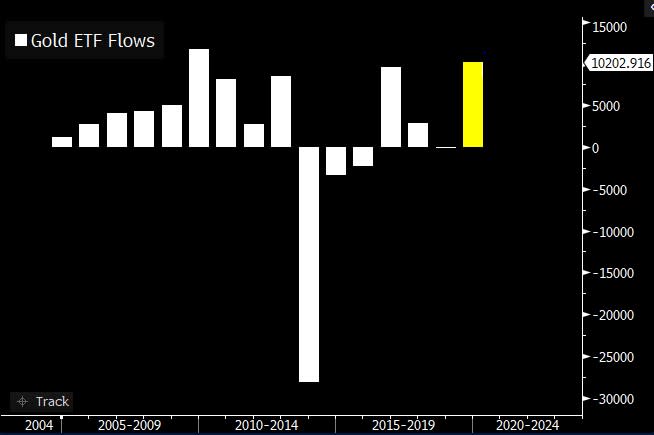
Flows Are Golden
Flows arguably reflect investor decisions and sentiment. Eric Balchunas of Bloomberg pointed out on Twitter Friday that annual gold ETF flows are just shy of the $10 billion record set in 2009, which is a “notable feat given the increase competition (and attacks) from crypto, as well as the fact that in 2009 gold was up 10% more than this year.”
However, according to Bloomberg, even more notable is the fact that gold was up about 30.14% over the previous two years when the S&P 500 was down 20.15% (Dec. 31, 2007 to Dec. 31, 2009). Could it be that flows are telegraphing market sentiment for risk management?
The market tone is that of complacency, and while tactical investing has generally not read the tea leaves well these past 10 years, it’s worth noting that the SPDR Gold Trust (GLD) was up 68.23% from Dec. 31, 2007 to Dec. 31, 2010 versus a negative 8.12%, so in certain periods, tactical has paid off.
Tactical Defense
The iShares allocation funds targeting risk funds were launched on Nov. 11, 2008, and during the preceding two years, GLD was up 91.06%—about triple that of the iShares Core Moderate Allocation ETF (AOM), the moderate risk allocation. The point is that gold added value during the tough periods, and a tactical increase would have helped lower volatility and even add alpha.
Of course, this was a special period, and since November 2010, GLD has mostly only treaded water—up about 3.19%.
What is a fair risk-adjusted return, or at least an easy way to measure such an objective: active, passive, traditional beta or smart beta? All these labels are complicated; especially when you throw in the definition of factors.
The answer arguably may lie with AOM and three other ETFs from that iShares suite:
Together they only have $4 billion in assets under management (AUM). Don’t shoot the “ETF Nerd” messenger. The fact is that for an expense ratio of 0.25%, each these four ETFs provide for a BlackRock research definition of what is a portfolio with an aggressive allocation, growth allocation, moderate allocation and conservative focus.
There are also 71 other ways to participate in this allocation category that holds about $13 billion in AUM.

Allocation strategies can be especially complex, but they can provide a solution to lower volatility in portfolios. We also break down the list into subcategories: active, passive, tactical, hedge fund replication.
Noteworthy is the fact that the average fee in this subcategory is 0.36% and the weighted average fee is 0.52%. This matters because these products provide a benchmark for pricing as well as performance.
We expect that this category as a solution will expand meaningfully as active demonstrates value and markets get choppy. However, these ETFs will need to communicate a concise message.
Below we share the top 10 allocation ETFs by AUM from our Toroso Security Master and Key Performance Indicators specific to this asset class:

For a larger view, please click on the image above.
New Launches Accelerate
As ETF Nerds, we were pleased to see 34 new ETFs to analyze in September and that the open/close ratio rebounded to 1.61 from 1.45. This meant that the number of ETFs now is at 2,294, up from 2,278 in August.
Leading the charge of new listings was Franklin Liberty, with the active Franklin Liberty U.S. Core Bond ETF (FLCB), which has an impressive $861 million since launching on Sept. 17. The haul in assets is a result of what is commonly referred to as “bring your own assets” (BYOA), a trend we have been seeing more of from large wealth management firms entering the ETF space.
Over the past 12 months, the number of ETFs is up 8.4%, there are 239 new launches and 148 closures.
Assets Rebound To New Record
As of Sept. 30, 2019, assets in ETFs rebounded to $4,047 trillion, a second record month-end close, a nearly 2% increase from August’s $3,968 trillion.
Another KPI of significance is our metric that measures revenues from expense ratios, which showed a slight increase to $7.59 billion, but less than the $7.68 billion back in July. Nontraditional and active ETFs closed the month with market shares of 38.88% and 5.7%, respectively. The average weighted expense ratio remains at 0.19% despite all the talk of fee wars.
Revenue Grows, Fees Fall
The average weighted expense ratio for U.S. ETFs remains the same, at 0.19% from July 31. Fee compression may be a slow continuum, but with increased assets, the projected 12-month revenue increased from $6.83 billion in January to $7.59 billion today.
The percentage of ETF revenue from nontraditional passive ETFs in January was 36.38%; today it’s 38.88%. Active ETF revenue also gained market share, growing from 5.11% to 5.70%. These KPIs help show that investors are still looking for interesting and creative strategies to help diversify their portfolio.

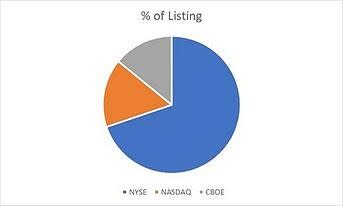
Exchange Market Share Steady
There has been very little material movement in ETF exchange market share of listings, with NYSE remaining in the dominant position, at 69.27%. Cboe Global Markets, parent company of ETF.com, has 14.08%; Nasdaq remains at 16.17%.
Don’t Buy An ETF, But Have An ETF Strategy For Your Business
In this report, we focus on the allocations strategy as a subcategory of ETFs, because this category ultimately could contribute to significant growth in the ETF industry. For instance, hedge fund investors could benefit by the tax efficiency of the wrapper.
Currently, it is barely one-third of 1% of the overall $4,047 trillion in AUM. If growth in AUM is going to expand in trillion-dollar increments, it will not be just from flows to broad, low-cost beta, but because of tax efficiency and access to investment solutions in a changing environment.
Contact Dan Weiskopf at dweiskopf@torosoinv.com
Recommended Stories

