Key Market Indicator Could Signal More Gains Ahead for Nasdaq
Last week I wrote about the monthly Relative Strength Index (RSI) on the Nasdaq Composite (IXIC). Friday marked the end of July, so the index's RSI officially closed the month above the 70-level. Based on the mainstream interpretation of this indicator, it's officially in overbought territory. Last week I showed historically, the Nasdaq tends to do well in the next month after it crosses this threshold only to peter out after that. As contrarians, however, we're wary of looking at indicators in the same way as the general public. That said, this week I'm taking a deeper dive into this indicator and see if there's a better signal we might use, or if anything changes when we layer on some sentiment data.
What Happens When the RSI Crosses 80?
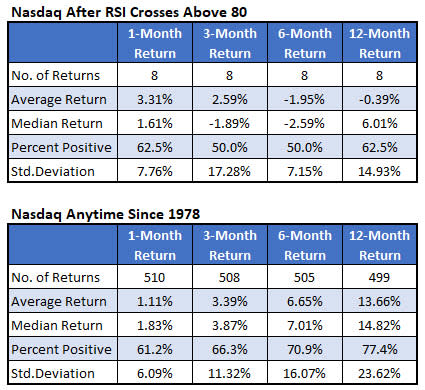
If the “smart money” likes the market due to fundamentals, they'll be happy to buy the index from weaker hands who are getting nervous about the RSI crossing the popular 70-level. Let's stretch the overbought target to RSI 80. The table below shows how the index has performed after the RSI crosses above the 80 level.
Similar to when we used 70 as the overbought level, using 80 still shows outperformance over the next month. When you get farther out than that, however, the index struggled quite a bit. Six months after the extended RSI target, the Nasdaq averages about a 2% loss with half of the eight returns negative. Even a year after these signals, the index still averages a negative return. The RSI has just crossed 70 on a monthly basis, so there's no urgency for now. It seems worthy to keep an eye on though, and as the RSI moves higher, it could indicate a frothy market.
Investor Sentiment & the RSI
We're believers that investor sentiment has major implications on the market. Our contrarian philosophy is that when investor sentiment gets too bullish, it will have bearish implications on the market going forward. To gauge what investors think about this market, I'm looking at a couple sentiment surveys. The problem, however, is that the surveys are coming to different conclusions (I may write more on this next week). The sentiment survey by Investors Intelligence (II) indicates investors are very bullish on stocks right now. The survey done by the American Association of Individual Investors (AAII) is telling us investors are pessimistic. I'll take a look at where both these surveys stood when the RSI on the Nasdaq crossed 70, and how the market tended to react afterwards.
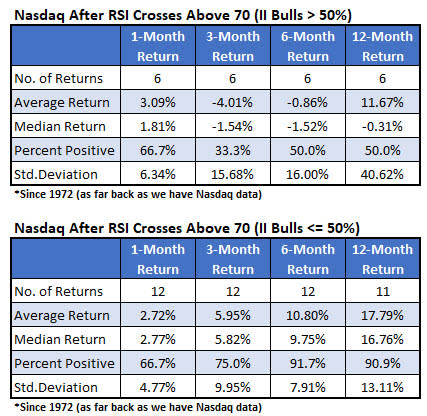
First, I'm looking at the II survey. Currently, it shows 57% of investor newsletters are bullish on stocks right now. That is a high level of optimism (newsletters are considered bullish, bearish, or expecting a correction). Out of the 18 signals in which the monthly RSI crossed above 70, six times the percentage of bulls in the II poll were over 50%. As usual, the first month has been bullish showing momentum is strong in the very short term. After that, however, the return took a drastic downward move. The three-month return after these signals shows the Nasdaq averaging a 4% loss with just a third of the returns positive. That's where the pullback tends to bottom, as the six-month returns average around breakeven. Then after one year, returns average in double-digits. But even that is significantly less than the returns after the RSI crosses 70 and 50% -- meaning less of the investors are bullish.
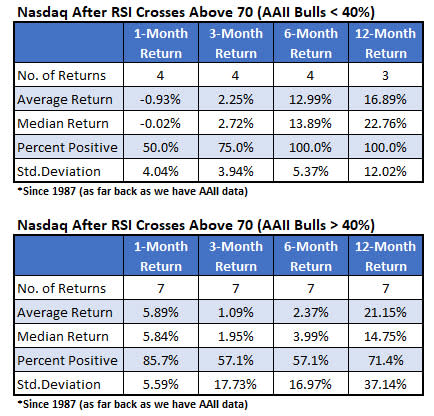
As I mentioned, unlike the II poll, the AAII poll shows pessimism. Only about 20% of those polled by the AAII survey are bullish on the stock market. Based on our contrarian philosophy, this will have bullish implications going forward. AAII data only goes back to 1987 so there are fewer signals (11 signals instead of 18). Four times the AAII poll showed less than 40% were bullish. In those times, the next month was bearish but after that the returns have been strong. Six months after these signals, the Nasdaq averaged a gain of about 13%, with all four returns positive. In the other seven instances, the index averaged just a 2.4% return with 57% of the returns positive.
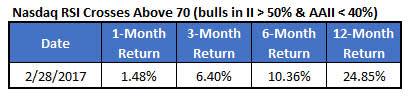
The two polls are showing different sentiment towards the market and the studies above came to different conclusions. Finally, I looked to see if there were ever times where the Nasdaq RSI crossed above 70 when the II poll shows bullishness, and the AAII poll showed bearishness. There was one occurrence in February of 2017. That ended up being a good time to buy stocks.