Should You Like Keyrus S.A.’s (EPA:KEY) High Return On Capital Employed?

Today we'll evaluate Keyrus S.A. (EPA:KEY) to determine whether it could have potential as an investment idea. To be precise, we'll consider its Return On Capital Employed (ROCE), as that will inform our view of the quality of the business.
First of all, we'll work out how to calculate ROCE. Then we'll compare its ROCE to similar companies. And finally, we'll look at how its current liabilities are impacting its ROCE.
What is Return On Capital Employed (ROCE)?
ROCE is a measure of a company's yearly pre-tax profit (its return), relative to the capital employed in the business. Generally speaking a higher ROCE is better. Ultimately, it is a useful but imperfect metric. Renowned investment researcher Michael Mauboussin has suggested that a high ROCE can indicate that 'one dollar invested in the company generates value of more than one dollar'.
So, How Do We Calculate ROCE?
The formula for calculating the return on capital employed is:
Return on Capital Employed = Earnings Before Interest and Tax (EBIT) ÷ (Total Assets - Current Liabilities)
Or for Keyrus:
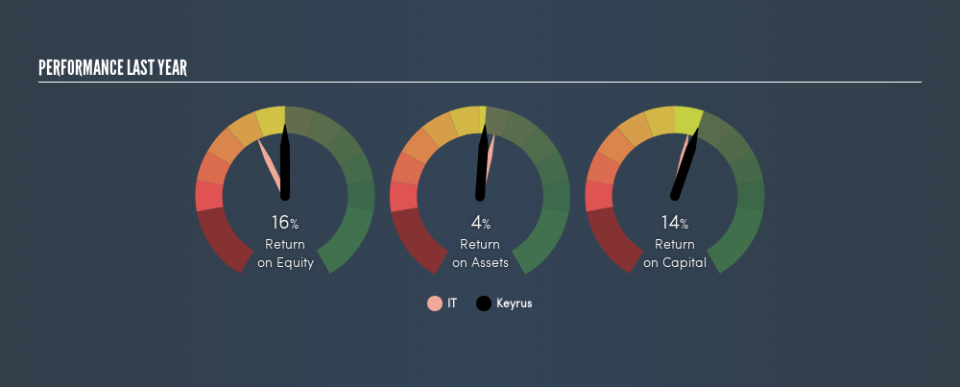
0.14 = €14m ÷ (€244m - €142m) (Based on the trailing twelve months to December 2018.)
Therefore, Keyrus has an ROCE of 14%.
View our latest analysis for Keyrus
Does Keyrus Have A Good ROCE?
One way to assess ROCE is to compare similar companies. Keyrus's ROCE appears to be substantially greater than the 12% average in the IT industry. We consider this a positive sign, because it suggests it uses capital more efficiently than similar companies. Separate from Keyrus's performance relative to its industry, its ROCE in absolute terms looks satisfactory, and it may be worth researching in more depth.
You can click on the image below to see (in greater detail) how Keyrus's past growth compares to other companies.
When considering ROCE, bear in mind that it reflects the past and does not necessarily predict the future. ROCE can be deceptive for cyclical businesses, as returns can look incredible in boom times, and terribly low in downturns. This is because ROCE only looks at one year, instead of considering returns across a whole cycle. If Keyrus is cyclical, it could make sense to check out this free graph of past earnings, revenue and cash flow.
How Keyrus's Current Liabilities Impact Its ROCE
Liabilities, such as supplier bills and bank overdrafts, are referred to as current liabilities if they need to be paid within 12 months. Due to the way ROCE is calculated, a high level of current liabilities makes a company look as though it has less capital employed, and thus can (sometimes unfairly) boost the ROCE. To check the impact of this, we calculate if a company has high current liabilities relative to its total assets.
Keyrus has total liabilities of €142m and total assets of €244m. As a result, its current liabilities are equal to approximately 58% of its total assets. Keyrus has a relatively high level of current liabilities, boosting its ROCE meaningfully.
What We Can Learn From Keyrus's ROCE
This ROCE is pretty good, but remember that it would look less impressive with fewer current liabilities. Keyrus shapes up well under this analysis, but it is far from the only business delivering excellent numbers . You might also want to check this free collection of companies delivering excellent earnings growth.
I will like Keyrus better if I see some big insider buys. While we wait, check out this free list of growing companies with considerable, recent, insider buying.
We aim to bring you long-term focused research analysis driven by fundamental data. Note that our analysis may not factor in the latest price-sensitive company announcements or qualitative material.
If you spot an error that warrants correction, please contact the editor at editorial-team@simplywallst.com. This article by Simply Wall St is general in nature. It does not constitute a recommendation to buy or sell any stock, and does not take account of your objectives, or your financial situation. Simply Wall St has no position in the stocks mentioned. Thank you for reading.

