How Do KFM Kingdom Holdings Limited’s (HKG:3816) Returns Compare To Its Industry?

Today we are going to look at KFM Kingdom Holdings Limited (HKG:3816) to see whether it might be an attractive investment prospect. Specifically, we're going to calculate its Return On Capital Employed (ROCE), in the hopes of getting some insight into the business.
First, we'll go over how we calculate ROCE. Then we'll compare its ROCE to similar companies. And finally, we'll look at how its current liabilities are impacting its ROCE.
Understanding Return On Capital Employed (ROCE)
ROCE measures the 'return' (pre-tax profit) a company generates from capital employed in its business. Generally speaking a higher ROCE is better. In brief, it is a useful tool, but it is not without drawbacks. Renowned investment researcher Michael Mauboussin has suggested that a high ROCE can indicate that 'one dollar invested in the company generates value of more than one dollar'.
So, How Do We Calculate ROCE?
Analysts use this formula to calculate return on capital employed:
Return on Capital Employed = Earnings Before Interest and Tax (EBIT) ÷ (Total Assets - Current Liabilities)
Or for KFM Kingdom Holdings:
0.045 = HK$28m ÷ (HK$1.1b - HK$459m) (Based on the trailing twelve months to September 2019.)
Therefore, KFM Kingdom Holdings has an ROCE of 4.5%.
Check out our latest analysis for KFM Kingdom Holdings
Is KFM Kingdom Holdings's ROCE Good?
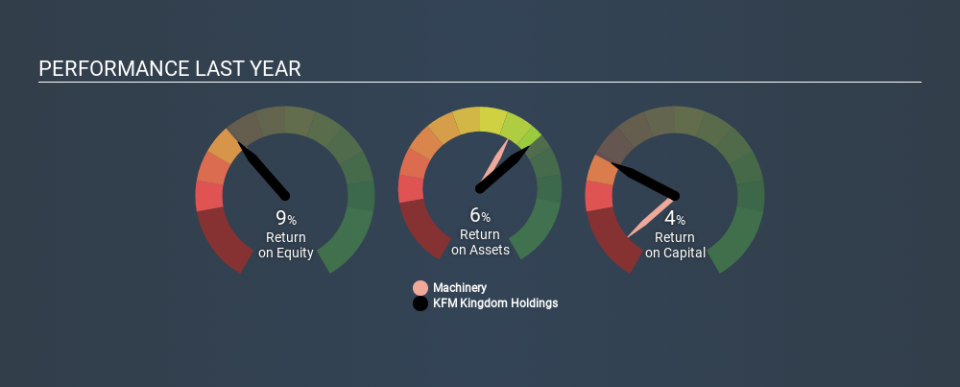
ROCE can be useful when making comparisons, such as between similar companies. We can see KFM Kingdom Holdings's ROCE is meaningfully below the Machinery industry average of 11%. This performance is not ideal, as it suggests the company may not be deploying its capital as effectively as some competitors. Independently of how KFM Kingdom Holdings compares to its industry, its ROCE in absolute terms is low; especially compared to the ~1.6% available in government bonds. It is likely that there are more attractive prospects out there.
KFM Kingdom Holdings reported an ROCE of 4.5% -- better than 3 years ago, when the company didn't make a profit. This makes us wonder if the company is improving. You can click on the image below to see (in greater detail) how KFM Kingdom Holdings's past growth compares to other companies.
Remember that this metric is backwards looking - it shows what has happened in the past, and does not accurately predict the future. Companies in cyclical industries can be difficult to understand using ROCE, as returns typically look high during boom times, and low during busts. This is because ROCE only looks at one year, instead of considering returns across a whole cycle. You can check if KFM Kingdom Holdings has cyclical profits by looking at this free graph of past earnings, revenue and cash flow.
KFM Kingdom Holdings's Current Liabilities And Their Impact On Its ROCE
Short term (or current) liabilities, are things like supplier invoices, overdrafts, or tax bills that need to be paid within 12 months. Due to the way ROCE is calculated, a high level of current liabilities makes a company look as though it has less capital employed, and thus can (sometimes unfairly) boost the ROCE. To counteract this, we check if a company has high current liabilities, relative to its total assets.
KFM Kingdom Holdings has total liabilities of HK$459m and total assets of HK$1.1b. As a result, its current liabilities are equal to approximately 42% of its total assets. KFM Kingdom Holdings has a medium level of current liabilities (boosting the ROCE somewhat), and a low ROCE.
The Bottom Line On KFM Kingdom Holdings's ROCE
This company may not be the most attractive investment prospect. Of course, you might find a fantastic investment by looking at a few good candidates. So take a peek at this free list of companies with modest (or no) debt, trading on a P/E below 20.
If you like to buy stocks alongside management, then you might just love this free list of companies. (Hint: insiders have been buying them).
If you spot an error that warrants correction, please contact the editor at editorial-team@simplywallst.com. This article by Simply Wall St is general in nature. It does not constitute a recommendation to buy or sell any stock, and does not take account of your objectives, or your financial situation. Simply Wall St has no position in the stocks mentioned.
We aim to bring you long-term focused research analysis driven by fundamental data. Note that our analysis may not factor in the latest price-sensitive company announcements or qualitative material. Thank you for reading.
