Here’s What Kid ASA’s (OB:KID) P/E Ratio Is Telling Us

The goal of this article is to teach you how to use price to earnings ratios (P/E ratios). We’ll look at Kid ASA’s (OB:KID) P/E ratio and reflect on what it tells us about the company’s share price. Kid has a P/E ratio of 10.24, based on the last twelve months. That is equivalent to an earnings yield of about 9.8%.
See our latest analysis for Kid
Want to participate in a research study? Help shape the future of investing tools and earn a $60 gift card!
How Do I Calculate A Price To Earnings Ratio?
The formula for price to earnings is:
Price to Earnings Ratio = Price per Share ÷ Earnings per Share (EPS)
Or for Kid:
P/E of 10.24 = NOK42.5 ÷ NOK4.15 (Based on the year to December 2018.)
Is A High Price-to-Earnings Ratio Good?
A higher P/E ratio means that buyers have to pay a higher price for each NOK1 the company has earned over the last year. All else being equal, it’s better to pay a low price — but as Warren Buffett said, ‘It’s far better to buy a wonderful company at a fair price than a fair company at a wonderful price.’
How Growth Rates Impact P/E Ratios
P/E ratios primarily reflect market expectations around earnings growth rates. Earnings growth means that in the future the ‘E’ will be higher. That means unless the share price increases, the P/E will reduce in a few years. So while a stock may look expensive based on past earnings, it could be cheap based on future earnings.
Kid increased earnings per share by an impressive 19% over the last twelve months. And it has bolstered its earnings per share by 11% per year over the last five years. This could arguably justify a relatively high P/E ratio.
How Does Kid’s P/E Ratio Compare To Its Peers?
We can get an indication of market expectations by looking at the P/E ratio. If you look at the image below, you can see Kid has a lower P/E than the average (12.8) in the specialty retail industry classification.
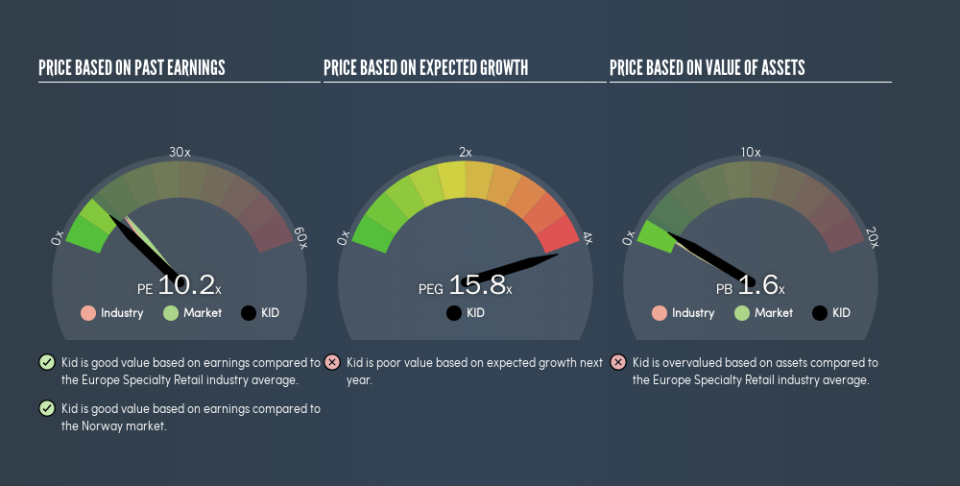
Its relatively low P/E ratio indicates that Kid shareholders think it will struggle to do as well as other companies in its industry classification. Since the market seems unimpressed with Kid, it’s quite possible it could surprise on the upside. It is arguably worth checking if insiders are buying shares, because that might imply they believe the stock is undervalued.
A Limitation: P/E Ratios Ignore Debt and Cash In The Bank
The ‘Price’ in P/E reflects the market capitalization of the company. In other words, it does not consider any debt or cash that the company may have on the balance sheet. Theoretically, a business can improve its earnings (and produce a lower P/E in the future), by taking on debt (or spending its remaining cash).
Such spending might be good or bad, overall, but the key point here is that you need to look at debt to understand the P/E ratio in context.
Kid’s Balance Sheet
Net debt totals 11% of Kid’s market cap. That’s enough debt to impact the P/E ratio a little; so keep it in mind if you’re comparing it to companies without debt.
The Bottom Line On Kid’s P/E Ratio
Kid’s P/E is 10.2 which is below average (13.4) in the NO market. The company hasn’t stretched its balance sheet, and earnings growth was good last year. The low P/E ratio suggests current market expectations are muted, implying these levels of growth will not continue.
When the market is wrong about a stock, it gives savvy investors an opportunity. As value investor Benjamin Graham famously said, ‘In the short run, the market is a voting machine but in the long run, it is a weighing machine.’ So this free report on the analyst consensus forecasts could help you make a master move on this stock.
You might be able to find a better buy than Kid. If you want a selection of possible winners, check out this free list of interesting companies that trade on a P/E below 20 (but have proven they can grow earnings).
We aim to bring you long-term focused research analysis driven by fundamental data. Note that our analysis may not factor in the latest price-sensitive company announcements or qualitative material.
If you spot an error that warrants correction, please contact the editor at editorial-team@simplywallst.com. This article by Simply Wall St is general in nature. It does not constitute a recommendation to buy or sell any stock, and does not take account of your objectives, or your financial situation. Simply Wall St has no position in the stocks mentioned. Thank you for reading.

