Do You Like Kimberly-Clark Corporation (NYSE:KMB) At This P/E Ratio?

Today, we'll introduce the concept of the P/E ratio for those who are learning about investing. We'll apply a basic P/E ratio analysis to Kimberly-Clark Corporation's (NYSE:KMB), to help you decide if the stock is worth further research. Looking at earnings over the last twelve months, Kimberly-Clark has a P/E ratio of 25.89. In other words, at today's prices, investors are paying $25.89 for every $1 in prior year profit.
Check out our latest analysis for Kimberly-Clark
How Do I Calculate Kimberly-Clark's Price To Earnings Ratio?
The formula for P/E is:
Price to Earnings Ratio = Share Price ÷ Earnings per Share (EPS)
Or for Kimberly-Clark:
P/E of 25.89 = $135.04 ÷ $5.21 (Based on the trailing twelve months to June 2019.)
Is A High Price-to-Earnings Ratio Good?
A higher P/E ratio implies that investors pay a higher price for the earning power of the business. All else being equal, it's better to pay a low price -- but as Warren Buffett said, 'It's far better to buy a wonderful company at a fair price than a fair company at a wonderful price.
How Does Kimberly-Clark's P/E Ratio Compare To Its Peers?
The P/E ratio indicates whether the market has higher or lower expectations of a company. You can see in the image below that the average P/E (26.7) for companies in the household products industry is roughly the same as Kimberly-Clark's P/E.
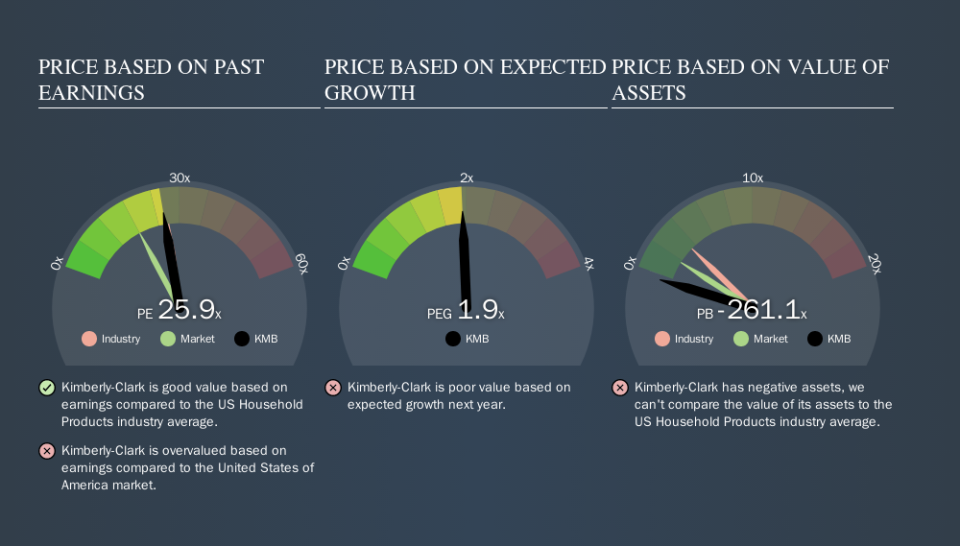
That indicates that the market expects Kimberly-Clark will perform roughly in line with other companies in its industry. So if Kimberly-Clark actually outperforms its peers going forward, that should be a positive for the share price. Checking factors such as director buying and selling. could help you form your own view on if that will happen.
How Growth Rates Impact P/E Ratios
If earnings fall then in the future the 'E' will be lower. Therefore, even if you pay a low multiple of earnings now, that multiple will become higher in the future. So while a stock may look cheap based on past earnings, it could be expensive based on future earnings.
Kimberly-Clark increased earnings per share by 5.6% last year. And its annual EPS growth rate over 5 years is 1.2%. Unfortunately, earnings per share are down 1.3% a year, over 3 years.
Don't Forget: The P/E Does Not Account For Debt or Bank Deposits
Don't forget that the P/E ratio considers market capitalization. In other words, it does not consider any debt or cash that the company may have on the balance sheet. Theoretically, a business can improve its earnings (and produce a lower P/E in the future) by investing in growth. That means taking on debt (or spending its cash).
Such expenditure might be good or bad, in the long term, but the point here is that the balance sheet is not reflected by this ratio.
Is Debt Impacting Kimberly-Clark's P/E?
Net debt totals 16% of Kimberly-Clark's market cap. This could bring some additional risk, and reduce the number of investment options for management; worth remembering if you compare its P/E to businesses without debt.
The Verdict On Kimberly-Clark's P/E Ratio
Kimberly-Clark's P/E is 25.9 which is above average (17.9) in its market. With modest debt relative to its size, and modest earnings growth, the market is likely expecting sustained long-term growth, if not a near-term improvement.
When the market is wrong about a stock, it gives savvy investors an opportunity. As value investor Benjamin Graham famously said, 'In the short run, the market is a voting machine but in the long run, it is a weighing machine. So this free report on the analyst consensus forecasts could help you make a master move on this stock.
Of course you might be able to find a better stock than Kimberly-Clark. So you may wish to see this free collection of other companies that have grown earnings strongly.
We aim to bring you long-term focused research analysis driven by fundamental data. Note that our analysis may not factor in the latest price-sensitive company announcements or qualitative material.
If you spot an error that warrants correction, please contact the editor at editorial-team@simplywallst.com. This article by Simply Wall St is general in nature. It does not constitute a recommendation to buy or sell any stock, and does not take account of your objectives, or your financial situation. Simply Wall St has no position in the stocks mentioned. Thank you for reading.
