What Kind Of Share Price Volatility Should You Expect For DataDot Technology Limited (ASX:DDT)?

Want to participate in a short research study? Help shape the future of investing tools and you could win a $250 gift card!
If you own shares in DataDot Technology Limited (ASX:DDT) then it's worth thinking about how it contributes to the volatility of your portfolio, overall. In finance, Beta is a measure of volatility. Modern finance theory considers volatility to be a measure of risk, and there are two main types of price volatility. First, we have company specific volatility, which is the price gyrations of an individual stock. Holding at least 8 stocks can reduce this kind of risk across a portfolio. The other type, which cannot be diversified away, is the volatility of the entire market. Every stock in the market is exposed to this volatility, which is linked to the fact that stocks prices are correlated in an efficient market.
Some stocks are more sensitive to general market forces than others. Some investors use beta as a measure of how much a certain stock is impacted by market risk (volatility). While we should keep in mind that Warren Buffett has cautioned that 'Volatility is far from synonymous with risk', beta is still a useful factor to consider. To make good use of it you must first know that the beta of the overall market is one. A stock with a beta below one is either less volatile than the market, or more volatile but not corellated with the overall market. In comparison a stock with a beta of over one tends to be move in a similar direction to the market in the long term, but with greater changes in price.
View our latest analysis for DataDot Technology
What does DDT's beta value mean to investors?
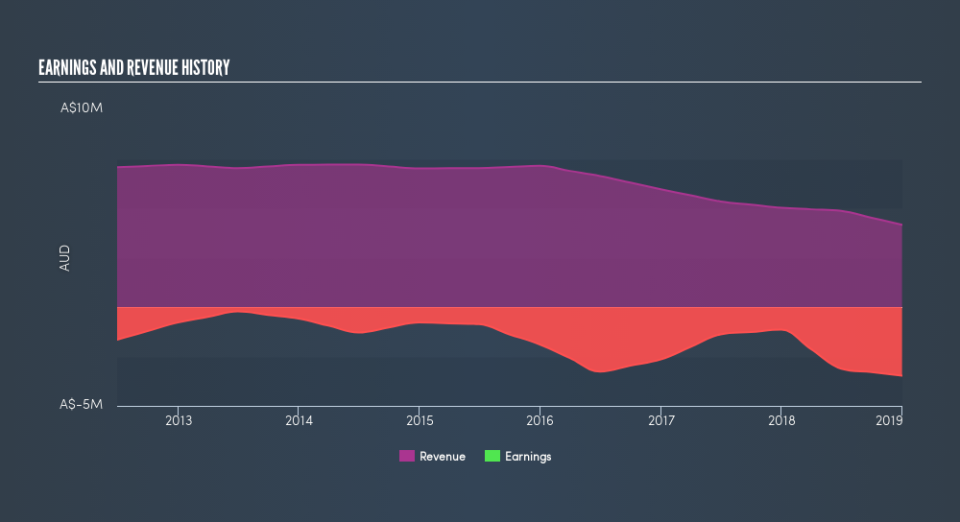
DataDot Technology has a five-year beta of 1.01. This is reasonably close to the market beta of 1, so the stock has in the past displayed similar levels of volatility to the overall market. While history does not always repeat, this may indicate that the stock price will continue to be exposed to market risk, albeit not overly so. Many would argue that beta is useful in position sizing, but fundamental metrics such as revenue and earnings are more important overall. You can see DataDot Technology's revenue and earnings in the image below.
Could DDT's size cause it to be more volatile?
DataDot Technology is a noticeably small company, with a market capitalisation of AU$7.3m. Most companies this size are not always actively traded. Companies this small are usually more volatile than the market, whether or not that volatility is correlated. Therefore, it's a bit surprising to see that this stock has a beta value so close to the overall market.
What this means for you:
It is probable that there is a link between the share price of DataDot Technology and the broader market, since it has a beta value quite close to one. However, long term investors are generally well served by looking past market volatility and focussing on the underlying development of the business. If that's your game, metrics such as revenue, earnings and cash flow will be more useful. This article aims to educate investors about beta values, but it's well worth looking at important company-specific fundamentals such as DataDot Technology’s financial health and performance track record. I highly recommend you dive deeper by considering the following:
Financial Health: Are DDT’s operations financially sustainable? Balance sheets can be hard to analyze, which is why we’ve done it for you. Check out our financial health checks here.
Past Track Record: Has DDT been consistently performing well irrespective of the ups and downs in the market? Go into more detail in the past performance analysis and take a look at the free visual representations of DDT's historicals for more clarity.
Other High-Performing Stocks: Are there other stocks that provide better prospects with proven track records? Explore our free list of these great stocks here.
We aim to bring you long-term focused research analysis driven by fundamental data. Note that our analysis may not factor in the latest price-sensitive company announcements or qualitative material.
If you spot an error that warrants correction, please contact the editor at editorial-team@simplywallst.com. This article by Simply Wall St is general in nature. It does not constitute a recommendation to buy or sell any stock, and does not take account of your objectives, or your financial situation. Simply Wall St has no position in the stocks mentioned. Thank you for reading.
