What Kind Of Shareholder Owns Most FireAngel Safety Technology Group plc (LON:FA.) Stock?

The big shareholder groups in FireAngel Safety Technology Group plc (LON:FA.) have power over the company. Generally speaking, as a company grows, institutions will increase their ownership. Conversely, insiders often decrease their ownership over time. I generally like to see some degree of insider ownership, even if only a little. As Nassim Nicholas Taleb said, 'Don’t tell me what you think, tell me what you have in your portfolio.'
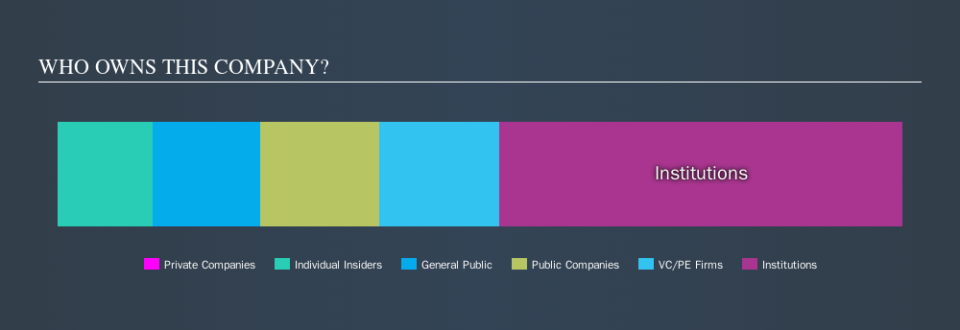
With a market capitalization of UK£19m, FireAngel Safety Technology Group is a small cap stock, so it might not be well known by many institutional investors. In the chart below below, we can see that institutional investors have bought into the company. We can zoom in on the different ownership groups, to learn more about FA..
See our latest analysis for FireAngel Safety Technology Group
What Does The Institutional Ownership Tell Us About FireAngel Safety Technology Group?
Institutional investors commonly compare their own returns to the returns of a commonly followed index. So they generally do consider buying larger companies that are included in the relevant benchmark index.
We can see that FireAngel Safety Technology Group does have institutional investors; and they hold 48% of the stock. This suggests some credibility amongst professional investors. But we can't rely on that fact alone, since institutions make bad investments sometimes, just like everyone does. If multiple institutions change their view on a stock at the same time, you could see the share price drop fast. It's therefore worth looking at FireAngel Safety Technology Group's earnings history, below. Of course, the future is what really matters.

Hedge funds don't have many shares in FireAngel Safety Technology Group. Our information suggests that there isn't any analyst coverage of the stock, so it is probably little known.
Insider Ownership Of FireAngel Safety Technology Group
While the precise definition of an insider can be subjective, almost everyone considers board members to be insiders. Management ultimately answers to the board. However, it is not uncommon for managers to be executive board members, especially if they are a founder or the CEO.
I generally consider insider ownership to be a good thing. However, on some occasions it makes it more difficult for other shareholders to hold the board accountable for decisions.
Our most recent data indicates that insiders own a reasonable proportion of FireAngel Safety Technology Group plc. It has a market capitalization of just UK£19m, and insiders have UK£2.2m worth of shares in their own names. This may suggest that the founders still own a lot of shares. You can click here to see if they have been buying or selling.
General Public Ownership
The general public, with a 13% stake in the company, will not easily be ignored. While this group can't necessarily call the shots, it can certainly have a real influence on how the company is run.
Private Equity Ownership
Private equity firms hold a 14% stake in FA.. This suggests they can be influential in key policy decisions. Some might like this, because private equity are sometimes activists who hold management accountable. But other times, private equity is selling out, having taking the company public.
Public Company Ownership
We can see that public companies hold 14%, of the FA. shares on issue. We can't be certain, but this is quite possible this is a strategic stake. The businesses may be similar, or work together.
Next Steps:
It's always worth thinking about the different groups who own shares in a company. But to understand FireAngel Safety Technology Group better, we need to consider many other factors.
I like to dive deeper into how a company has performed in the past. You can find historic revenue and earnings in this detailed graph.
Of course, you might find a fantastic investment by looking elsewhere. So take a peek at this free list of interesting companies.
NB: Figures in this article are calculated using data from the last twelve months, which refer to the 12-month period ending on the last date of the month the financial statement is dated. This may not be consistent with full year annual report figures.
We aim to bring you long-term focused research analysis driven by fundamental data. Note that our analysis may not factor in the latest price-sensitive company announcements or qualitative material.
If you spot an error that warrants correction, please contact the editor at editorial-team@simplywallst.com. This article by Simply Wall St is general in nature. It does not constitute a recommendation to buy or sell any stock, and does not take account of your objectives, or your financial situation. Simply Wall St has no position in the stocks mentioned. Thank you for reading.

