Is Kingsland Global (ASX:KLO) Using Too Much Debt?

Howard Marks put it nicely when he said that, rather than worrying about share price volatility, 'The possibility of permanent loss is the risk I worry about... and every practical investor I know worries about. So it might be obvious that you need to consider debt, when you think about how risky any given stock is, because too much debt can sink a company. We note that Kingsland Global Ltd. (ASX:KLO) does have debt on its balance sheet. But is this debt a concern to shareholders?
When Is Debt Dangerous?
Generally speaking, debt only becomes a real problem when a company can't easily pay it off, either by raising capital or with its own cash flow. Part and parcel of capitalism is the process of 'creative destruction' where failed businesses are mercilessly liquidated by their bankers. However, a more usual (but still expensive) situation is where a company must dilute shareholders at a cheap share price simply to get debt under control. By replacing dilution, though, debt can be an extremely good tool for businesses that need capital to invest in growth at high rates of return. The first thing to do when considering how much debt a business uses is to look at its cash and debt together.
See our latest analysis for Kingsland Global
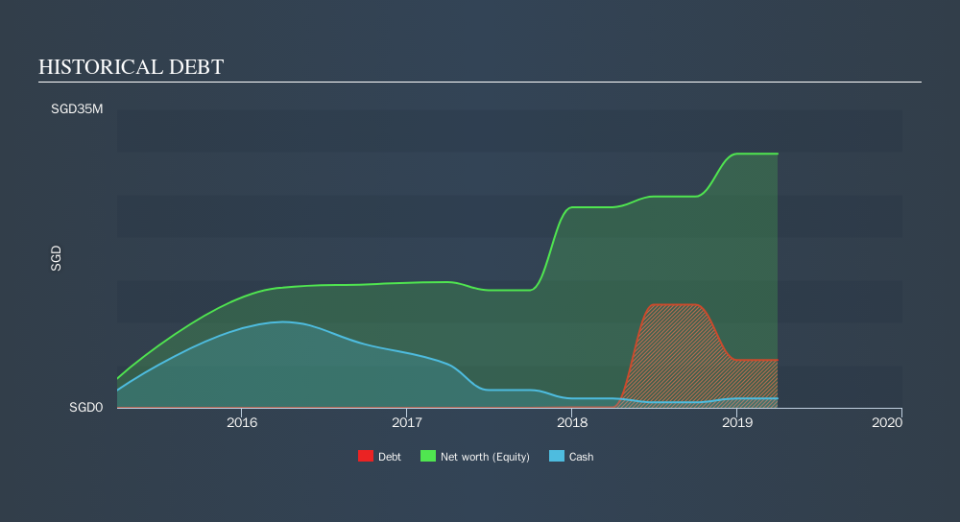
How Much Debt Does Kingsland Global Carry?
The image below, which you can click on for greater detail, shows that at March 2019 Kingsland Global had debt of S$5.60m, up from S$43.1k in one year. However, because it has a cash reserve of S$1.10m, its net debt is less, at about S$4.49m.
How Healthy Is Kingsland Global's Balance Sheet?
The latest balance sheet data shows that Kingsland Global had liabilities of S$16.1m due within a year, and liabilities of S$21.5m falling due after that. Offsetting this, it had S$1.10m in cash and S$37.7m in receivables that were due within 12 months. So it actually has S$1.26m more liquid assets than total liabilities.
This short term liquidity is a sign that Kingsland Global could probably pay off its debt with ease, as its balance sheet is far from stretched.
In order to size up a company's debt relative to its earnings, we calculate its net debt divided by its earnings before interest, tax, depreciation, and amortization (EBITDA) and its earnings before interest and tax (EBIT) divided by its interest expense (its interest cover). This way, we consider both the absolute quantum of the debt, as well as the interest rates paid on it.
Kingsland Global's net debt is only 0.59 times its EBITDA. And its EBIT covers its interest expense a whopping 57.1 times over. So you could argue it is no more threatened by its debt than an elephant is by a mouse. It was also good to see that despite losing money on the EBIT line last year, Kingsland Global turned things around in the last 12 months, delivering and EBIT of S$7.6m. When analysing debt levels, the balance sheet is the obvious place to start. But you can't view debt in total isolation; since Kingsland Global will need earnings to service that debt. So if you're keen to discover more about its earnings, it might be worth checking out this graph of its long term earnings trend.
Finally, a company can only pay off debt with cold hard cash, not accounting profits. So it's worth checking how much of the earnings before interest and tax (EBIT) is backed by free cash flow. Over the last year, Kingsland Global actually produced more free cash flow than EBIT. There's nothing better than incoming cash when it comes to staying in your lenders' good graces.
Our View
The good news is that Kingsland Global's demonstrated ability to cover its interest expense with its EBIT delights us like a fluffy puppy does a toddler. And the good news does not stop there, as its conversion of EBIT to free cash flow also supports that impression! Zooming out, Kingsland Global seems to use debt quite reasonably; and that gets the nod from us. After all, sensible leverage can boost returns on equity. Over time, share prices tend to follow earnings per share, so if you're interested in Kingsland Global, you may well want to click here to check an interactive graph of its earnings per share history.
Of course, if you're the type of investor who prefers buying stocks without the burden of debt, then don't hesitate to discover our exclusive list of net cash growth stocks, today.
We aim to bring you long-term focused research analysis driven by fundamental data. Note that our analysis may not factor in the latest price-sensitive company announcements or qualitative material.
If you spot an error that warrants correction, please contact the editor at editorial-team@simplywallst.com. This article by Simply Wall St is general in nature. It does not constitute a recommendation to buy or sell any stock, and does not take account of your objectives, or your financial situation. Simply Wall St has no position in the stocks mentioned. Thank you for reading.
