KION GROUP AG’s (ETR:KGX) Investment Returns Are Lagging Its Industry

Today we'll evaluate KION GROUP AG (ETR:KGX) to determine whether it could have potential as an investment idea. Specifically, we'll consider its Return On Capital Employed (ROCE), since that will give us an insight into how efficiently the business can generate profits from the capital it requires.
First up, we'll look at what ROCE is and how we calculate it. Then we'll compare its ROCE to similar companies. Finally, we'll look at how its current liabilities affect its ROCE.
Understanding Return On Capital Employed (ROCE)
ROCE is a measure of a company's yearly pre-tax profit (its return), relative to the capital employed in the business. In general, businesses with a higher ROCE are usually better quality. Overall, it is a valuable metric that has its flaws. Author Edwin Whiting says to be careful when comparing the ROCE of different businesses, since 'No two businesses are exactly alike.'
So, How Do We Calculate ROCE?
Analysts use this formula to calculate return on capital employed:
Return on Capital Employed = Earnings Before Interest and Tax (EBIT) ÷ (Total Assets - Current Liabilities)
Or for KION GROUP:
0.072 = €674m ÷ (€14b - €4.1b) (Based on the trailing twelve months to June 2019.)
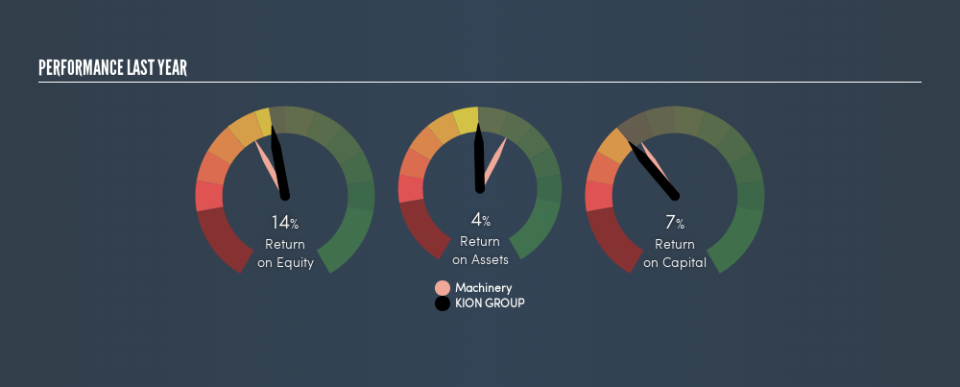
Therefore, KION GROUP has an ROCE of 7.2%.
View our latest analysis for KION GROUP
Is KION GROUP's ROCE Good?
ROCE can be useful when making comparisons, such as between similar companies. Using our data, KION GROUP's ROCE appears to be significantly below the 9.5% average in the Machinery industry. This performance is not ideal, as it suggests the company may not be deploying its capital as effectively as some competitors. Separate from how KION GROUP stacks up against its industry, its ROCE in absolute terms is mediocre; relative to the returns on government bonds. Investors may wish to consider higher-performing investments.
You can see in the image below how KION GROUP's ROCE compares to its industry. Click to see more on past growth.
When considering this metric, keep in mind that it is backwards looking, and not necessarily predictive. Companies in cyclical industries can be difficult to understand using ROCE, as returns typically look high during boom times, and low during busts. This is because ROCE only looks at one year, instead of considering returns across a whole cycle. Since the future is so important for investors, you should check out our free report on analyst forecasts for KION GROUP.
How KION GROUP's Current Liabilities Impact Its ROCE
Short term (or current) liabilities, are things like supplier invoices, overdrafts, or tax bills that need to be paid within 12 months. The ROCE equation subtracts current liabilities from capital employed, so a company with a lot of current liabilities appears to have less capital employed, and a higher ROCE than otherwise. To check the impact of this, we calculate if a company has high current liabilities relative to its total assets.
KION GROUP has total assets of €14b and current liabilities of €4.1b. As a result, its current liabilities are equal to approximately 30% of its total assets. KION GROUP has a medium level of current liabilities, which would boost its ROCE somewhat.
Our Take On KION GROUP's ROCE
Unfortunately, its ROCE is still uninspiring, and there are potentially more attractive prospects out there. But note: make sure you look for a great company, not just the first idea you come across. So take a peek at this free list of interesting companies with strong recent earnings growth (and a P/E ratio below 20).
I will like KION GROUP better if I see some big insider buys. While we wait, check out this free list of growing companies with considerable, recent, insider buying.
We aim to bring you long-term focused research analysis driven by fundamental data. Note that our analysis may not factor in the latest price-sensitive company announcements or qualitative material.
If you spot an error that warrants correction, please contact the editor at editorial-team@simplywallst.com. This article by Simply Wall St is general in nature. It does not constitute a recommendation to buy or sell any stock, and does not take account of your objectives, or your financial situation. Simply Wall St has no position in the stocks mentioned. Thank you for reading.

