Is Kip McGrath Education Centres Limited’s (ASX:KME) 26% ROCE Any Good?

Today we are going to look at Kip McGrath Education Centres Limited (ASX:KME) to see whether it might be an attractive investment prospect. Specifically, we're going to calculate its Return On Capital Employed (ROCE), in the hopes of getting some insight into the business.
First, we'll go over how we calculate ROCE. Second, we'll look at its ROCE compared to similar companies. Last but not least, we'll look at what impact its current liabilities have on its ROCE.
Understanding Return On Capital Employed (ROCE)
ROCE measures the 'return' (pre-tax profit) a company generates from capital employed in its business. In general, businesses with a higher ROCE are usually better quality. Overall, it is a valuable metric that has its flaws. Renowned investment researcher Michael Mauboussin has suggested that a high ROCE can indicate that 'one dollar invested in the company generates value of more than one dollar'.
How Do You Calculate Return On Capital Employed?
Analysts use this formula to calculate return on capital employed:
Return on Capital Employed = Earnings Before Interest and Tax (EBIT) ÷ (Total Assets - Current Liabilities)
Or for Kip McGrath Education Centres:
0.26 = AU$3.4m ÷ (AU$21m - AU$8.1m) (Based on the trailing twelve months to June 2019.)
Therefore, Kip McGrath Education Centres has an ROCE of 26%.
View our latest analysis for Kip McGrath Education Centres
Does Kip McGrath Education Centres Have A Good ROCE?
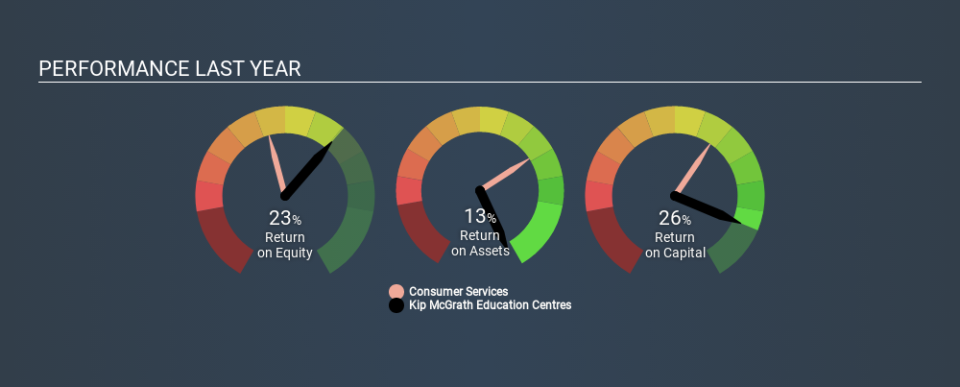
When making comparisons between similar businesses, investors may find ROCE useful. In our analysis, Kip McGrath Education Centres's ROCE is meaningfully higher than the 9.2% average in the Consumer Services industry. We consider this a positive sign, because it suggests it uses capital more efficiently than similar companies. Setting aside the comparison to its industry for a moment, Kip McGrath Education Centres's ROCE in absolute terms currently looks quite high.
In our analysis, Kip McGrath Education Centres's ROCE appears to be 26%, compared to 3 years ago, when its ROCE was 16%. This makes us wonder if the company is improving. You can see in the image below how Kip McGrath Education Centres's ROCE compares to its industry. Click to see more on past growth.
When considering ROCE, bear in mind that it reflects the past and does not necessarily predict the future. ROCE can be misleading for companies in cyclical industries, with returns looking impressive during the boom times, but very weak during the busts. ROCE is, after all, simply a snap shot of a single year. If Kip McGrath Education Centres is cyclical, it could make sense to check out this free graph of past earnings, revenue and cash flow.
Do Kip McGrath Education Centres's Current Liabilities Skew Its ROCE?
Current liabilities are short term bills and invoices that need to be paid in 12 months or less. Due to the way ROCE is calculated, a high level of current liabilities makes a company look as though it has less capital employed, and thus can (sometimes unfairly) boost the ROCE. To check the impact of this, we calculate if a company has high current liabilities relative to its total assets.
Kip McGrath Education Centres has total assets of AU$21m and current liabilities of AU$8.1m. As a result, its current liabilities are equal to approximately 38% of its total assets. A medium level of current liabilities boosts Kip McGrath Education Centres's ROCE somewhat.
The Bottom Line On Kip McGrath Education Centres's ROCE
Despite this, it reports a high ROCE, and may be worth investigating further. Kip McGrath Education Centres shapes up well under this analysis, but it is far from the only business delivering excellent numbers . You might also want to check this free collection of companies delivering excellent earnings growth.
For those who like to find winning investments this free list of growing companies with recent insider purchasing, could be just the ticket.
If you spot an error that warrants correction, please contact the editor at editorial-team@simplywallst.com. This article by Simply Wall St is general in nature. It does not constitute a recommendation to buy or sell any stock, and does not take account of your objectives, or your financial situation. Simply Wall St has no position in the stocks mentioned.
We aim to bring you long-term focused research analysis driven by fundamental data. Note that our analysis may not factor in the latest price-sensitive company announcements or qualitative material. Thank you for reading.

