Is KML Technology Group Limited’s (HKG:8065) 16% Return On Capital Employed Good News?

Want to participate in a short research study? Help shape the future of investing tools and you could win a $250 gift card!
Today we are going to look at KML Technology Group Limited (HKG:8065) to see whether it might be an attractive investment prospect. In particular, we'll consider its Return On Capital Employed (ROCE), as that can give us insight into how profitably the company is able to employ capital in its business.
First up, we'll look at what ROCE is and how we calculate it. Then we'll compare its ROCE to similar companies. Last but not least, we'll look at what impact its current liabilities have on its ROCE.
Return On Capital Employed (ROCE): What is it?
ROCE is a measure of a company's yearly pre-tax profit (its return), relative to the capital employed in the business. All else being equal, a better business will have a higher ROCE. In brief, it is a useful tool, but it is not without drawbacks. Renowned investment researcher Michael Mauboussin has suggested that a high ROCE can indicate that 'one dollar invested in the company generates value of more than one dollar'.
So, How Do We Calculate ROCE?
Analysts use this formula to calculate return on capital employed:
Return on Capital Employed = Earnings Before Interest and Tax (EBIT) ÷ (Total Assets - Current Liabilities)
Or for KML Technology Group:
0.16 = HK$23m ÷ (HK$189m - HK$45m) (Based on the trailing twelve months to March 2019.)
So, KML Technology Group has an ROCE of 16%.
Check out our latest analysis for KML Technology Group
Does KML Technology Group Have A Good ROCE?
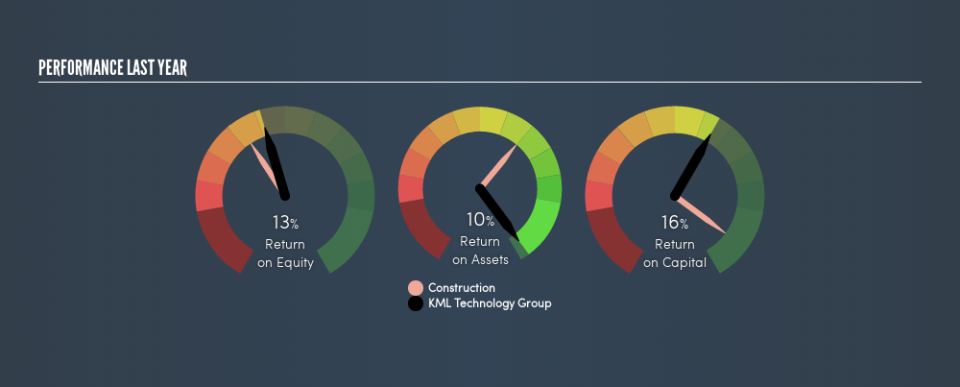
When making comparisons between similar businesses, investors may find ROCE useful. We can see KML Technology Group's ROCE is around the 13% average reported by the Construction industry. Separate from KML Technology Group's performance relative to its industry, its ROCE in absolute terms looks satisfactory, and it may be worth researching in more depth.
KML Technology Group's current ROCE of 16% is lower than its ROCE in the past, which was 27%, 3 years ago. This makes us wonder if the business is facing new challenges. The image below shows how KML Technology Group's ROCE compares to its industry, and you can click it to see more detail on its past growth.
It is important to remember that ROCE shows past performance, and is not necessarily predictive. Companies in cyclical industries can be difficult to understand using ROCE, as returns typically look high during boom times, and low during busts. This is because ROCE only looks at one year, instead of considering returns across a whole cycle. How cyclical is KML Technology Group? You can see for yourself by looking at this free graph of past earnings, revenue and cash flow.
How KML Technology Group's Current Liabilities Impact Its ROCE
Current liabilities are short term bills and invoices that need to be paid in 12 months or less. Due to the way the ROCE equation works, having large bills due in the near term can make it look as though a company has less capital employed, and thus a higher ROCE than usual. To check the impact of this, we calculate if a company has high current liabilities relative to its total assets.
KML Technology Group has total assets of HK$189m and current liabilities of HK$45m. Therefore its current liabilities are equivalent to approximately 24% of its total assets. Low current liabilities are not boosting the ROCE too much.
Our Take On KML Technology Group's ROCE
This is good to see, and with a sound ROCE, KML Technology Group could be worth a closer look. There might be better investments than KML Technology Group out there, but you will have to work hard to find them . These promising businesses with rapidly growing earnings might be right up your alley.
If you are like me, then you will not want to miss this free list of growing companies that insiders are buying.
We aim to bring you long-term focused research analysis driven by fundamental data. Note that our analysis may not factor in the latest price-sensitive company announcements or qualitative material.
If you spot an error that warrants correction, please contact the editor at editorial-team@simplywallst.com. This article by Simply Wall St is general in nature. It does not constitute a recommendation to buy or sell any stock, and does not take account of your objectives, or your financial situation. Simply Wall St has no position in the stocks mentioned. Thank you for reading.
