Do You Know What Ajmera Realty & Infra India Limited's (NSE:AJMERA) P/E Ratio Means?

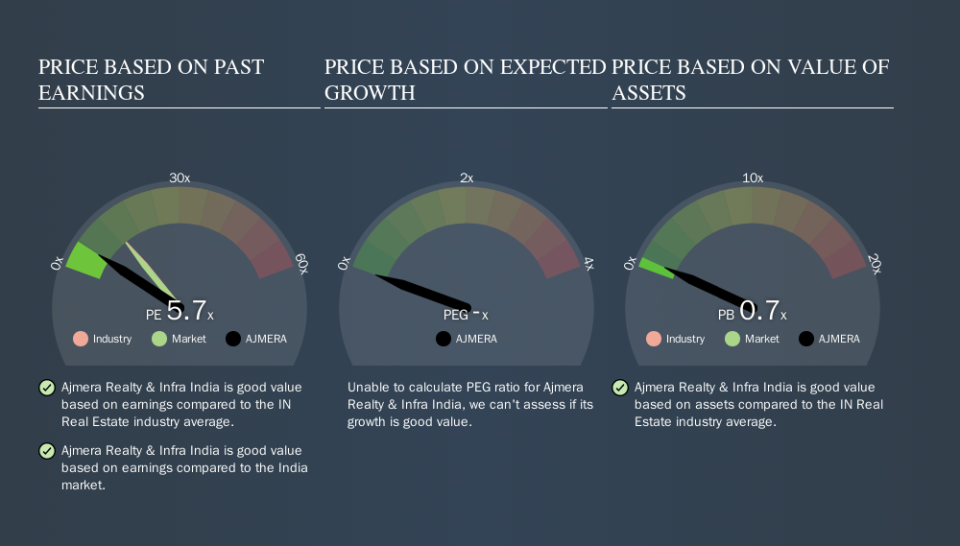
This article is for investors who would like to improve their understanding of price to earnings ratios (P/E ratios). To keep it practical, we'll show how Ajmera Realty & Infra India Limited's (NSE:AJMERA) P/E ratio could help you assess the value on offer. Ajmera Realty & Infra India has a price to earnings ratio of 5.74, based on the last twelve months. In other words, at today's prices, investors are paying ₹5.74 for every ₹1 in prior year profit.
View our latest analysis for Ajmera Realty & Infra India
How Do You Calculate A P/E Ratio?
The formula for P/E is:
Price to Earnings Ratio = Share Price ÷ Earnings per Share (EPS)
Or for Ajmera Realty & Infra India:
P/E of 5.74 = ₹117.30 ÷ ₹20.45 (Based on the trailing twelve months to June 2019.)
Is A High Price-to-Earnings Ratio Good?
A higher P/E ratio means that investors are paying a higher price for each ₹1 of company earnings. That is not a good or a bad thing per se, but a high P/E does imply buyers are optimistic about the future.
How Does Ajmera Realty & Infra India's P/E Ratio Compare To Its Peers?
We can get an indication of market expectations by looking at the P/E ratio. If you look at the image below, you can see Ajmera Realty & Infra India has a lower P/E than the average (13.4) in the real estate industry classification.
Its relatively low P/E ratio indicates that Ajmera Realty & Infra India shareholders think it will struggle to do as well as other companies in its industry classification. Many investors like to buy stocks when the market is pessimistic about their prospects. If you consider the stock interesting, further research is recommended. For example, I often monitor director buying and selling.
How Growth Rates Impact P/E Ratios
Probably the most important factor in determining what P/E a company trades on is the earnings growth. That's because companies that grow earnings per share quickly will rapidly increase the 'E' in the equation. Therefore, even if you pay a high multiple of earnings now, that multiple will become lower in the future. So while a stock may look expensive based on past earnings, it could be cheap based on future earnings.
Ajmera Realty & Infra India shrunk earnings per share by 10% over the last year. But over the longer term (5 years) earnings per share have increased by 34%.
Don't Forget: The P/E Does Not Account For Debt or Bank Deposits
The 'Price' in P/E reflects the market capitalization of the company. In other words, it does not consider any debt or cash that the company may have on the balance sheet. Hypothetically, a company could reduce its future P/E ratio by spending its cash (or taking on debt) to achieve higher earnings.
Spending on growth might be good or bad a few years later, but the point is that the P/E ratio does not account for the option (or lack thereof).
Is Debt Impacting Ajmera Realty & Infra India's P/E?
Ajmera Realty & Infra India's net debt is considerable, at 202% of its market cap. This level of debt justifies a relatively low P/E, so remain cognizant of the debt, if you're comparing it to other stocks.
The Verdict On Ajmera Realty & Infra India's P/E Ratio
Ajmera Realty & Infra India trades on a P/E ratio of 5.7, which is below the IN market average of 13.1. When you consider that the company has significant debt, and didn't grow EPS last year, it isn't surprising that the market has muted expectations.
When the market is wrong about a stock, it gives savvy investors an opportunity. As value investor Benjamin Graham famously said, 'In the short run, the market is a voting machine but in the long run, it is a weighing machine. We don't have analyst forecasts, but shareholders might want to examine this detailed historical graph of earnings, revenue and cash flow.
But note: Ajmera Realty & Infra India may not be the best stock to buy. So take a peek at this free list of interesting companies with strong recent earnings growth (and a P/E ratio below 20).
We aim to bring you long-term focused research analysis driven by fundamental data. Note that our analysis may not factor in the latest price-sensitive company announcements or qualitative material.
If you spot an error that warrants correction, please contact the editor at editorial-team@simplywallst.com. This article by Simply Wall St is general in nature. It does not constitute a recommendation to buy or sell any stock, and does not take account of your objectives, or your financial situation. Simply Wall St has no position in the stocks mentioned. Thank you for reading.
