Do You Know What Amsterdam Commodities N.V.'s (AMS:ACOMO) P/E Ratio Means?

This article is written for those who want to get better at using price to earnings ratios (P/E ratios). We'll apply a basic P/E ratio analysis to Amsterdam Commodities N.V.'s (AMS:ACOMO), to help you decide if the stock is worth further research. Based on the last twelve months, Amsterdam Commodities's P/E ratio is 16.2. That is equivalent to an earnings yield of about 6.2%.
View our latest analysis for Amsterdam Commodities
How Do You Calculate A P/E Ratio?
The formula for price to earnings is:
Price to Earnings Ratio = Share Price ÷ Earnings per Share (EPS)
Or for Amsterdam Commodities:
P/E of 16.2 = €20.45 ÷ €1.26 (Based on the year to December 2018.)
Is A High Price-to-Earnings Ratio Good?
The higher the P/E ratio, the higher the price tag of a business, relative to its trailing earnings. All else being equal, it's better to pay a low price -- but as Warren Buffett said, 'It's far better to buy a wonderful company at a fair price than a fair company at a wonderful price.'
How Growth Rates Impact P/E Ratios
Companies that shrink earnings per share quickly will rapidly decrease the 'E' in the equation. Therefore, even if you pay a low multiple of earnings now, that multiple will become higher in the future. So while a stock may look cheap based on past earnings, it could be expensive based on future earnings.
Amsterdam Commodities's earnings per share fell by 4.8% in the last twelve months. But EPS is up 1.5% over the last 5 years. And it has shrunk its earnings per share by 2.3% per year over the last three years. This growth rate might warrant a low P/E ratio. So it would be surprising to see a high P/E.
How Does Amsterdam Commodities's P/E Ratio Compare To Its Peers?
One good way to get a quick read on what market participants expect of a company is to look at its P/E ratio. If you look at the image below, you can see Amsterdam Commodities has a lower P/E than the average (19.3) in the consumer retailing industry classification.
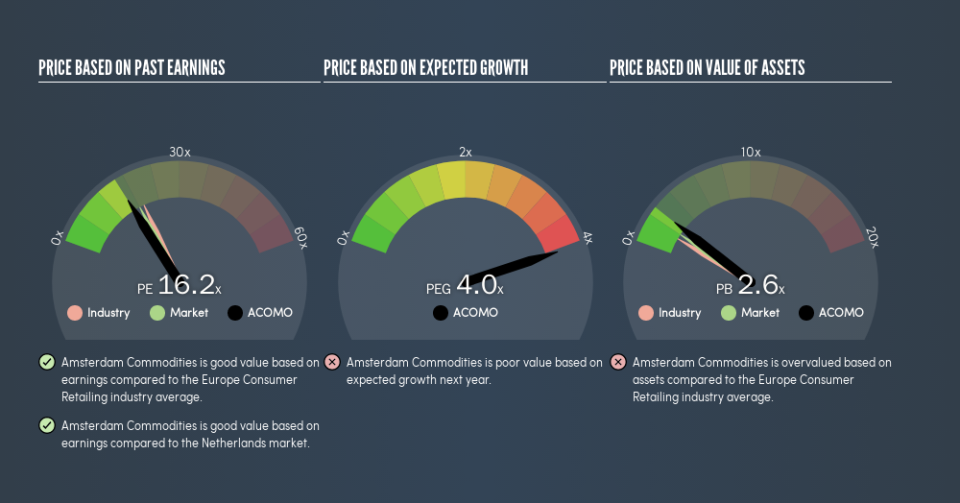
This suggests that market participants think Amsterdam Commodities will underperform other companies in its industry. Since the market seems unimpressed with Amsterdam Commodities, it's quite possible it could surprise on the upside. It is arguably worth checking if insiders are buying shares, because that might imply they believe the stock is undervalued.
A Limitation: P/E Ratios Ignore Debt and Cash In The Bank
The 'Price' in P/E reflects the market capitalization of the company. So it won't reflect the advantage of cash, or disadvantage of debt. In theory, a company can lower its future P/E ratio by using cash or debt to invest in growth.
Such spending might be good or bad, overall, but the key point here is that you need to look at debt to understand the P/E ratio in context.
Is Debt Impacting Amsterdam Commodities's P/E?
Amsterdam Commodities has net debt worth 18% of its market capitalization. This could bring some additional risk, and reduce the number of investment options for management; worth remembering if you compare its P/E to businesses without debt.
The Bottom Line On Amsterdam Commodities's P/E Ratio
Amsterdam Commodities's P/E is 16.2 which is below average (18) in the NL market. With only modest debt, it's likely the lack of EPS growth at least partially explains the pessimism implied by the P/E ratio.
Investors should be looking to buy stocks that the market is wrong about. As value investor Benjamin Graham famously said, 'In the short run, the market is a voting machine but in the long run, it is a weighing machine.' So this free visual report on analyst forecasts could hold the key to an excellent investment decision.
Of course you might be able to find a better stock than Amsterdam Commodities. So you may wish to see this free collection of other companies that have grown earnings strongly.
We aim to bring you long-term focused research analysis driven by fundamental data. Note that our analysis may not factor in the latest price-sensitive company announcements or qualitative material.
If you spot an error that warrants correction, please contact the editor at editorial-team@simplywallst.com. This article by Simply Wall St is general in nature. It does not constitute a recommendation to buy or sell any stock, and does not take account of your objectives, or your financial situation. Simply Wall St has no position in the stocks mentioned. Thank you for reading.

