Do You Know What Bestway Global Holding Inc.'s (HKG:3358) P/E Ratio Means?

Want to participate in a short research study? Help shape the future of investing tools and you could win a $250 gift card!
Today, we'll introduce the concept of the P/E ratio for those who are learning about investing. We'll apply a basic P/E ratio analysis to Bestway Global Holding Inc.'s (HKG:3358), to help you decide if the stock is worth further research. Bestway Global Holding has a P/E ratio of 11.26, based on the last twelve months. In other words, at today's prices, investors are paying HK$11.26 for every HK$1 in prior year profit.
Check out our latest analysis for Bestway Global Holding
How Do I Calculate A Price To Earnings Ratio?
The formula for P/E is:
Price to Earnings Ratio = Share Price (in reporting currency) ÷ Earnings per Share (EPS)
Or for Bestway Global Holding:
P/E of 11.26 = $0.46 (Note: this is the share price in the reporting currency, namely, USD ) ÷ $0.041 (Based on the year to December 2018.)
Is A High P/E Ratio Good?
A higher P/E ratio implies that investors pay a higher price for the earning power of the business. All else being equal, it's better to pay a low price -- but as Warren Buffett said, 'It's far better to buy a wonderful company at a fair price than a fair company at a wonderful price.'
How Growth Rates Impact P/E Ratios
Earnings growth rates have a big influence on P/E ratios. Earnings growth means that in the future the 'E' will be higher. That means unless the share price increases, the P/E will reduce in a few years. So while a stock may look expensive based on past earnings, it could be cheap based on future earnings.
Bestway Global Holding's earnings per share fell by 29% in the last twelve months. But over the longer term (5 years) earnings per share have increased by 32%.
Does Bestway Global Holding Have A Relatively High Or Low P/E For Its Industry?
One good way to get a quick read on what market participants expect of a company is to look at its P/E ratio. The image below shows that Bestway Global Holding has a P/E ratio that is roughly in line with the leisure industry average (11.9).
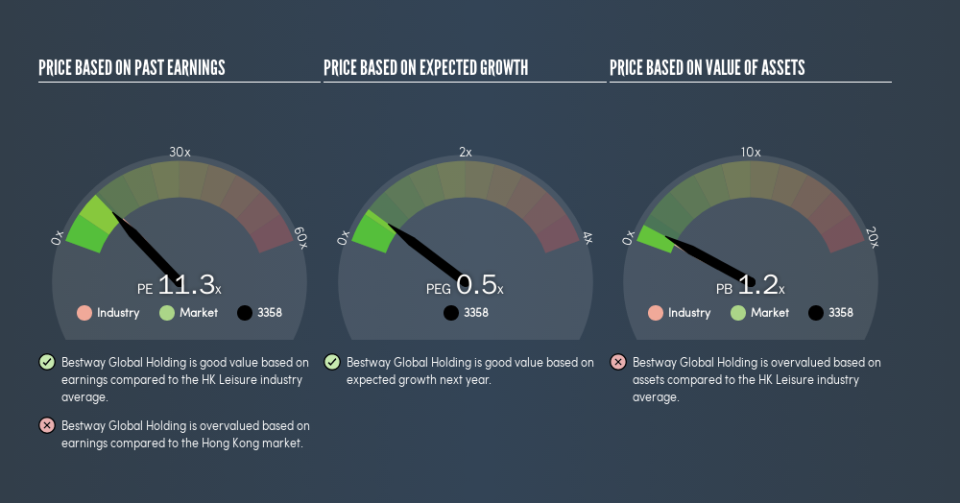
Bestway Global Holding's P/E tells us that market participants think its prospects are roughly in line with its industry. If the company has better than average prospects, then the market might be underestimating it. Checking factors such as the tenure of the board and management could help you form your own view on if that will happen.
A Limitation: P/E Ratios Ignore Debt and Cash In The Bank
The 'Price' in P/E reflects the market capitalization of the company. So it won't reflect the advantage of cash, or disadvantage of debt. Hypothetically, a company could reduce its future P/E ratio by spending its cash (or taking on debt) to achieve higher earnings.
Such spending might be good or bad, overall, but the key point here is that you need to look at debt to understand the P/E ratio in context.
Is Debt Impacting Bestway Global Holding's P/E?
Bestway Global Holding's net debt equates to 38% of its market capitalization. While that's enough to warrant consideration, it doesn't really concern us.
The Bottom Line On Bestway Global Holding's P/E Ratio
Bestway Global Holding has a P/E of 11.3. That's around the same as the average in the HK market, which is 10.8. With modest debt, and a lack of recent growth, it would seem the market is expecting improvement in earnings.
Investors should be looking to buy stocks that the market is wrong about. If the reality for a company is better than it expects, you can make money by buying and holding for the long term. So this free visualization of the analyst consensus on future earnings could help you make the right decision about whether to buy, sell, or hold.
You might be able to find a better buy than Bestway Global Holding. If you want a selection of possible winners, check out this free list of interesting companies that trade on a P/E below 20 (but have proven they can grow earnings).
We aim to bring you long-term focused research analysis driven by fundamental data. Note that our analysis may not factor in the latest price-sensitive company announcements or qualitative material.
If you spot an error that warrants correction, please contact the editor at editorial-team@simplywallst.com. This article by Simply Wall St is general in nature. It does not constitute a recommendation to buy or sell any stock, and does not take account of your objectives, or your financial situation. Simply Wall St has no position in the stocks mentioned. Thank you for reading.

