What To Know Before Buying Sixt SE (ETR:SIX2) For Its Dividend

Could Sixt SE (ETR:SIX2) be an attractive dividend share to own for the long haul? Investors are often drawn to strong companies with the idea of reinvesting the dividends. If you are hoping to live on your dividends, it's important to be more stringent with your investments than the average punter. Regular readers know we like to apply the same approach to each dividend stock, and we hope you'll find our analysis useful.
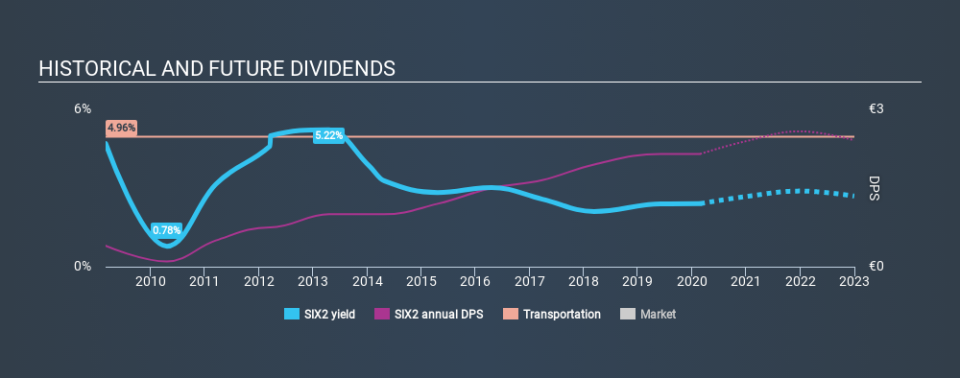
A slim 2.4% yield is hard to get excited about, but the long payment history is respectable. At the right price, or with strong growth opportunities, Sixt could have potential. Some simple analysis can reduce the risk of holding Sixt for its dividend, and we'll focus on the most important aspects below.
Explore this interactive chart for our latest analysis on Sixt!
Payout ratios
Companies (usually) pay dividends out of their earnings. If a company is paying more than it earns, the dividend might have to be cut. Comparing dividend payments to a company's net profit after tax is a simple way of reality-checking whether a dividend is sustainable. Sixt paid out 44% of its profit as dividends, over the trailing twelve month period. A medium payout ratio strikes a good balance between paying dividends, and keeping enough back to invest in the business. Besides, if reinvestment opportunities dry up, the company has room to increase the dividend.
In addition to comparing dividends against profits, we should inspect whether the company generated enough cash to pay its dividend. Last year, Sixt paid a dividend while reporting negative free cash flow. While there may be an explanation, we think this behaviour is generally not sustainable.
Is Sixt's Balance Sheet Risky?
As Sixt has a meaningful amount of debt, we need to check its balance sheet to see if the company might have debt risks. A quick check of its financial situation can be done with two ratios: net debt divided by EBITDA (earnings before interest, tax, depreciation and amortisation), and net interest cover. Net debt to EBITDA measures total debt load relative to company earnings (lower = less debt), while net interest cover measures the ability to pay interest on the debt (higher = greater ability to pay interest costs). Sixt has net debt of 7.72 times its EBITDA, which implies meaningful risk if interest rates rise of earnings decline.
Net interest cover can be calculated by dividing earnings before interest and tax (EBIT) by the company's net interest expense. Sixt has EBIT of 9.57 times its interest expense, which we think is adequate. Adequate interest cover may make the debt look safe, relative to companies with a lower interest cover ratio. However with such a large mountain of debt overall, we're cautious of what could happen if interest rates rise.
We update our data on Sixt every 24 hours, so you can always get our latest analysis of its financial health, here.
Dividend Volatility
From the perspective of an income investor who wants to earn dividends for many years, there is not much point buying a stock if its dividend is regularly cut or is not reliable. For the purpose of this article, we only scrutinise the last decade of Sixt's dividend payments. The dividend has been cut on at least one occasion historically. During the past ten-year period, the first annual payment was €0.40 in 2010, compared to €2.15 last year. Dividends per share have grown at approximately 18% per year over this time. Sixt's dividend payments have fluctuated, so it hasn't grown 18% every year, but the CAGR is a useful rule of thumb for approximating the historical growth.
It's not great to see that the payment has been cut in the past. We're generally more wary of companies that have cut their dividend before, as they tend to perform worse in an economic downturn.
Dividend Growth Potential
With a relatively unstable dividend, it's even more important to evaluate if earnings per share (EPS) are growing - it's not worth taking the risk on a dividend getting cut, unless you might be rewarded with larger dividends in future. Strong earnings per share (EPS) growth might encourage our interest in the company despite fluctuating dividends, which is why it's great to see Sixt has grown its earnings per share at 20% per annum over the past five years. A company paying out less than a quarter of its earnings as dividends, and growing earnings at more than 10% per annum, looks to be right in the cusp of its growth phase. At the right price, we might be interested.
Conclusion
When we look at a dividend stock, we need to form a judgement on whether the dividend will grow, if the company is able to maintain it in a wide range of economic circumstances, and if the dividend payout is sustainable. Firstly, the company has a conservative payout ratio, although we'd note that its cashflow in the past year was substantially lower than its reported profit. We were also glad to see it growing earnings, but it was concerning to see the dividend has been cut at least once in the past. Ultimately, Sixt comes up short on our dividend analysis. It's not that we think it is a bad company - just that there are likely more appealing dividend prospects out there on this analysis.
Companies that are growing earnings tend to be the best dividend stocks over the long term. See what the 7 analysts we track are forecasting for Sixt for free with public analyst estimates for the company.
We have also put together a list of global stocks with a market capitalisation above $1bn and yielding more 3%.
If you spot an error that warrants correction, please contact the editor at editorial-team@simplywallst.com. This article by Simply Wall St is general in nature. It does not constitute a recommendation to buy or sell any stock, and does not take account of your objectives, or your financial situation. Simply Wall St has no position in the stocks mentioned.
We aim to bring you long-term focused research analysis driven by fundamental data. Note that our analysis may not factor in the latest price-sensitive company announcements or qualitative material. Thank you for reading.

