Do You Know What Comfort Systems USA, Inc.'s (NYSE:FIX) P/E Ratio Means?

Want to participate in a short research study? Help shape the future of investing tools and you could win a $250 gift card!
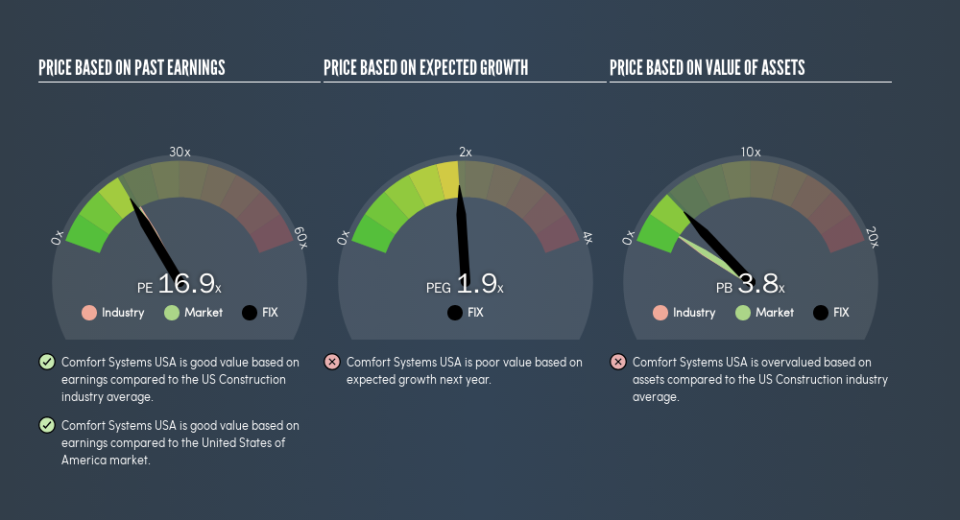
The goal of this article is to teach you how to use price to earnings ratios (P/E ratios). We'll look at Comfort Systems USA, Inc.'s (NYSE:FIX) P/E ratio and reflect on what it tells us about the company's share price. Based on the last twelve months, Comfort Systems USA's P/E ratio is 16.91. That corresponds to an earnings yield of approximately 5.9%.
View our latest analysis for Comfort Systems USA
How Do I Calculate A Price To Earnings Ratio?
The formula for price to earnings is:
Price to Earnings Ratio = Share Price ÷ Earnings per Share (EPS)
Or for Comfort Systems USA:
P/E of 16.91 = $52.88 ÷ $3.13 (Based on the trailing twelve months to March 2019.)
Is A High Price-to-Earnings Ratio Good?
The higher the P/E ratio, the higher the price tag of a business, relative to its trailing earnings. That is not a good or a bad thing per se, but a high P/E does imply buyers are optimistic about the future.
How Does Comfort Systems USA's P/E Ratio Compare To Its Peers?
One good way to get a quick read on what market participants expect of a company is to look at its P/E ratio. The image below shows that Comfort Systems USA has a P/E ratio that is roughly in line with the construction industry average (18.3).
Its P/E ratio suggests that Comfort Systems USA shareholders think that in the future it will perform about the same as other companies in its industry classification. If the company has better than average prospects, then the market might be underestimating it. I would further inform my view by checking insider buying and selling., among other things.
How Growth Rates Impact P/E Ratios
P/E ratios primarily reflect market expectations around earnings growth rates. That's because companies that grow earnings per share quickly will rapidly increase the 'E' in the equation. Therefore, even if you pay a high multiple of earnings now, that multiple will become lower in the future. So while a stock may look expensive based on past earnings, it could be cheap based on future earnings.
Comfort Systems USA's 81% EPS improvement over the last year was like bamboo growth after rain; rapid and impressive. The cherry on top is that the five year growth rate was an impressive 36% per year. So I'd be surprised if the P/E ratio was not above average.
Don't Forget: The P/E Does Not Account For Debt or Bank Deposits
It's important to note that the P/E ratio considers the market capitalization, not the enterprise value. That means it doesn't take debt or cash into account. In theory, a company can lower its future P/E ratio by using cash or debt to invest in growth.
Such expenditure might be good or bad, in the long term, but the point here is that the balance sheet is not reflected by this ratio.
So What Does Comfort Systems USA's Balance Sheet Tell Us?
Comfort Systems USA's net debt is 2.5% of its market cap. So it doesn't have as many options as it would with net cash, but its debt would not have much of an impact on its P/E ratio.
The Bottom Line On Comfort Systems USA's P/E Ratio
Comfort Systems USA's P/E is 16.9 which is about average (17.9) in the US market. When you consider the impressive EPS growth last year (along with some debt), it seems the market has questions about whether rapid EPS growth will be sustained. Since analysts are predicting growth will continue, one might expect to see a higher P/E so it may be worth looking closer.
Investors should be looking to buy stocks that the market is wrong about. If it is underestimating a company, investors can make money by buying and holding the shares until the market corrects itself. So this free visual report on analyst forecasts could hold the key to an excellent investment decision.
You might be able to find a better buy than Comfort Systems USA. If you want a selection of possible winners, check out this free list of interesting companies that trade on a P/E below 20 (but have proven they can grow earnings).
We aim to bring you long-term focused research analysis driven by fundamental data. Note that our analysis may not factor in the latest price-sensitive company announcements or qualitative material.
If you spot an error that warrants correction, please contact the editor at editorial-team@simplywallst.com. This article by Simply Wall St is general in nature. It does not constitute a recommendation to buy or sell any stock, and does not take account of your objectives, or your financial situation. Simply Wall St has no position in the stocks mentioned. Thank you for reading.
