Do You Know What D-Link (India) Limited's (NSE:DLINKINDIA) P/E Ratio Means?

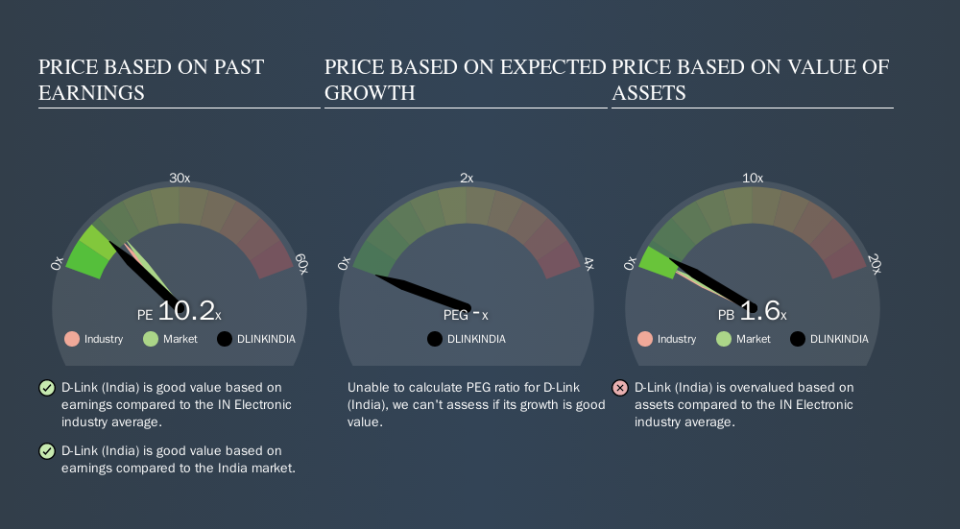
This article is written for those who want to get better at using price to earnings ratios (P/E ratios). We'll look at D-Link (India) Limited's (NSE:DLINKINDIA) P/E ratio and reflect on what it tells us about the company's share price. Based on the last twelve months, D-Link (India)'s P/E ratio is 10.16. That means that at current prices, buyers pay ₹10.16 for every ₹1 in trailing yearly profits.
View our latest analysis for D-Link (India)
How Do You Calculate A P/E Ratio?
The formula for price to earnings is:
Price to Earnings Ratio = Share Price ÷ Earnings per Share (EPS)
Or for D-Link (India):
P/E of 10.16 = ₹92 ÷ ₹9.06 (Based on the trailing twelve months to June 2019.)
Is A High Price-to-Earnings Ratio Good?
A higher P/E ratio means that buyers have to pay a higher price for each ₹1 the company has earned over the last year. That is not a good or a bad thing per se, but a high P/E does imply buyers are optimistic about the future.
Does D-Link (India) Have A Relatively High Or Low P/E For Its Industry?
The P/E ratio essentially measures market expectations of a company. If you look at the image below, you can see D-Link (India) has a lower P/E than the average (12.7) in the electronic industry classification.
This suggests that market participants think D-Link (India) will underperform other companies in its industry. While current expectations are low, the stock could be undervalued if the situation is better than the market assumes. If you consider the stock interesting, further research is recommended. For example, I often monitor director buying and selling.
How Growth Rates Impact P/E Ratios
P/E ratios primarily reflect market expectations around earnings growth rates. That's because companies that grow earnings per share quickly will rapidly increase the 'E' in the equation. And in that case, the P/E ratio itself will drop rather quickly. A lower P/E should indicate the stock is cheap relative to others -- and that may attract buyers.
D-Link (India)'s earnings made like a rocket, taking off 99% last year. Having said that, the average EPS growth over the last three years wasn't so good, coming in at 9.7%.
Remember: P/E Ratios Don't Consider The Balance Sheet
It's important to note that the P/E ratio considers the market capitalization, not the enterprise value. Thus, the metric does not reflect cash or debt held by the company. Theoretically, a business can improve its earnings (and produce a lower P/E in the future) by investing in growth. That means taking on debt (or spending its cash).
Such expenditure might be good or bad, in the long term, but the point here is that the balance sheet is not reflected by this ratio.
D-Link (India)'s Balance Sheet
Since D-Link (India) holds net cash of ₹177m, it can spend on growth, justifying a higher P/E ratio than otherwise.
The Verdict On D-Link (India)'s P/E Ratio
D-Link (India) trades on a P/E ratio of 10.2, which is below the IN market average of 13.7. It grew its EPS nicely over the last year, and the healthy balance sheet implies there is more potential for growth. One might conclude that the market is a bit pessimistic, given the low P/E ratio.
Investors should be looking to buy stocks that the market is wrong about. If it is underestimating a company, investors can make money by buying and holding the shares until the market corrects itself. We don't have analyst forecasts, but you might want to assess this data-rich visualization of earnings, revenue and cash flow.
But note: D-Link (India) may not be the best stock to buy. So take a peek at this free list of interesting companies with strong recent earnings growth (and a P/E ratio below 20).
We aim to bring you long-term focused research analysis driven by fundamental data. Note that our analysis may not factor in the latest price-sensitive company announcements or qualitative material.
If you spot an error that warrants correction, please contact the editor at editorial-team@simplywallst.com. This article by Simply Wall St is general in nature. It does not constitute a recommendation to buy or sell any stock, and does not take account of your objectives, or your financial situation. Simply Wall St has no position in the stocks mentioned. Thank you for reading.
