What You Should Know About EBOS Group Limited's (NZSE:EBO) Financial Strength

Want to participate in a short research study? Help shape the future of investing tools and you could win a $250 gift card!
EBOS Group Limited (NZSE:EBO) is a small-cap stock with a market capitalization of NZ$3.6b. While investors primarily focus on the growth potential and competitive landscape of the small-cap companies, they end up ignoring a key aspect, which could be the biggest threat to its existence: its financial health. Why is it important? Evaluating financial health as part of your investment thesis is essential, since poor capital management may bring about bankruptcies, which occur at a higher rate for small-caps. We'll look at some basic checks that can form a snapshot the company’s financial strength. Nevertheless, these checks don't give you a full picture, so I recommend you dig deeper yourself into EBO here.
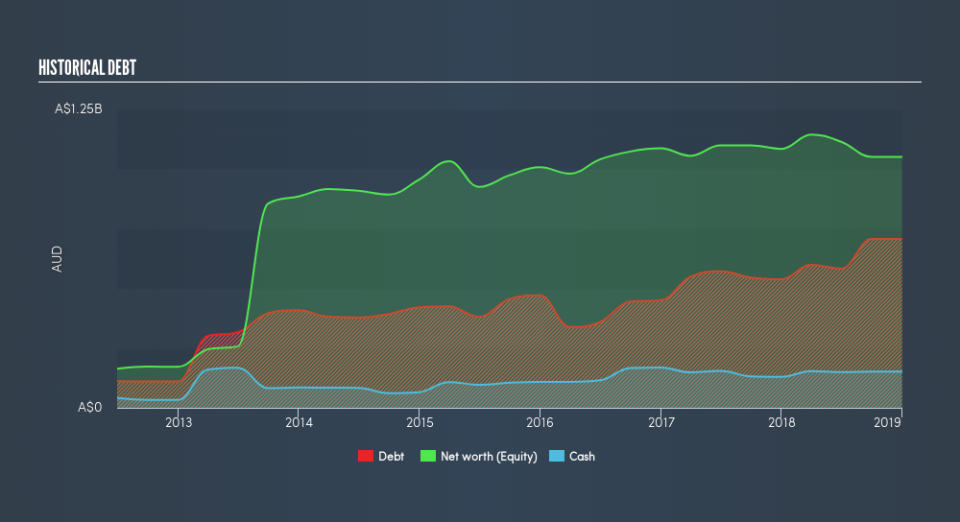
EBO’s Debt (And Cash Flows)
EBO's debt levels surged from AU$538m to AU$708m over the last 12 months , which accounts for long term debt. With this increase in debt, EBO currently has AU$152m remaining in cash and short-term investments to keep the business going. On top of this, EBO has generated AU$116m in operating cash flow during the same period of time, leading to an operating cash to total debt ratio of 16%, meaning that EBO’s debt is not covered by operating cash.
Does EBO’s liquid assets cover its short-term commitments?
Looking at EBO’s AU$1.4b in current liabilities, it appears that the company has been able to meet these commitments with a current assets level of AU$1.6b, leading to a 1.16x current account ratio. The current ratio is the number you get when you divide current assets by current liabilities. Usually, for Healthcare companies, this is a suitable ratio as there's enough of a cash buffer without holding too much capital in low return investments.
Does EBO face the risk of succumbing to its debt-load?
With debt reaching 67% of equity, EBO may be thought of as relatively highly levered. This is a bit unusual for a small-cap stock, since they generally have a harder time borrowing than large more established companies. We can test if EBO’s debt levels are sustainable by measuring interest payments against earnings of a company. Ideally, earnings before interest and tax (EBIT) should cover net interest by at least three times. For EBO, the ratio of 9.42x suggests that interest is appropriately covered, which means that lenders may be inclined to lend more money to the company, as it is seen as safe in terms of payback.
Next Steps:
Although EBO’s debt level is towards the higher end of the spectrum, its cash flow coverage seems adequate to meet obligations which means its debt is being efficiently utilised. This may mean this is an optimal capital structure for the business, given that it is also meeting its short-term commitment. Keep in mind I haven't considered other factors such as how EBO has been performing in the past. I recommend you continue to research EBOS Group to get a more holistic view of the small-cap by looking at:
Future Outlook: What are well-informed industry analysts predicting for EBO’s future growth? Take a look at our free research report of analyst consensus for EBO’s outlook.
Valuation: What is EBO worth today? Is the stock undervalued, even when its growth outlook is factored into its intrinsic value? The intrinsic value infographic in our free research report helps visualize whether EBO is currently mispriced by the market.
Other High-Performing Stocks: Are there other stocks that provide better prospects with proven track records? Explore our free list of these great stocks here.
We aim to bring you long-term focused research analysis driven by fundamental data. Note that our analysis may not factor in the latest price-sensitive company announcements or qualitative material.
If you spot an error that warrants correction, please contact the editor at editorial-team@simplywallst.com. This article by Simply Wall St is general in nature. It does not constitute a recommendation to buy or sell any stock, and does not take account of your objectives, or your financial situation. Simply Wall St has no position in the stocks mentioned. Thank you for reading.
