Do You Know What European Reliance General Insurance Company S.A.'s (ATH:EUPIC) P/E Ratio Means?

This article is for investors who would like to improve their understanding of price to earnings ratios (P/E ratios). We'll look at European Reliance General Insurance Company S.A.'s (ATH:EUPIC) P/E ratio and reflect on what it tells us about the company's share price. Based on the last twelve months, European Reliance General Insurance's P/E ratio is 10.63. That is equivalent to an earnings yield of about 9.4%.
Want to participate in a short research study? Help shape the future of investing tools and you could win a $250 gift card!
Check out our latest analysis for European Reliance General Insurance
How Do I Calculate A Price To Earnings Ratio?
The formula for price to earnings is:
Price to Earnings Ratio = Price per Share ÷ Earnings per Share (EPS)
Or for European Reliance General Insurance:
P/E of 10.63 = €4.14 ÷ €0.39 (Based on the trailing twelve months to December 2018.)
Is A High Price-to-Earnings Ratio Good?
A higher P/E ratio means that buyers have to pay a higher price for each €1 the company has earned over the last year. All else being equal, it's better to pay a low price -- but as Warren Buffett said, 'It's far better to buy a wonderful company at a fair price than a fair company at a wonderful price.'
How Growth Rates Impact P/E Ratios
When earnings fall, the 'E' decreases, over time. That means even if the current P/E is low, it will increase over time if the share price stays flat. So while a stock may look cheap based on past earnings, it could be expensive based on future earnings.
European Reliance General Insurance saw earnings per share decrease by 33% last year. But over the longer term (5 years) earnings per share have increased by 2.4%. And it has shrunk its earnings per share by 1.5% per year over the last three years. This could justify a low P/E.
Does European Reliance General Insurance Have A Relatively High Or Low P/E For Its Industry?
The P/E ratio indicates whether the market has higher or lower expectations of a company. The image below shows that European Reliance General Insurance has a lower P/E than the average (13.1) P/E for companies in the insurance industry.
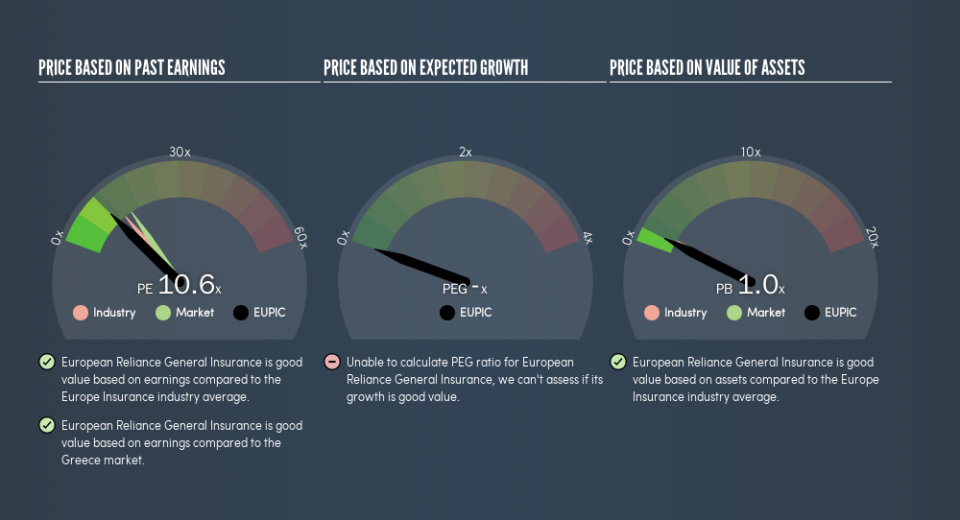
Its relatively low P/E ratio indicates that European Reliance General Insurance shareholders think it will struggle to do as well as other companies in its industry classification. Many investors like to buy stocks when the market is pessimistic about their prospects. It is arguably worth checking if insiders are buying shares, because that might imply they believe the stock is undervalued.
Don't Forget: The P/E Does Not Account For Debt or Bank Deposits
The 'Price' in P/E reflects the market capitalization of the company. In other words, it does not consider any debt or cash that the company may have on the balance sheet. Theoretically, a business can improve its earnings (and produce a lower P/E in the future) by investing in growth. That means taking on debt (or spending its cash).
While growth expenditure doesn't always pay off, the point is that it is a good option to have; but one that the P/E ratio ignores.
So What Does European Reliance General Insurance's Balance Sheet Tell Us?
The extra options and safety that comes with European Reliance General Insurance's €8.8m net cash position means that it deserves a higher P/E than it would if it had a lot of net debt.
The Bottom Line On European Reliance General Insurance's P/E Ratio
European Reliance General Insurance trades on a P/E ratio of 10.6, which is below the GR market average of 15.3. Falling earnings per share are likely to be keeping potential buyers away, but the net cash position means the company has time to improve: if so, the low P/E could be an opportunity.
Investors should be looking to buy stocks that the market is wrong about. If it is underestimating a company, investors can make money by buying and holding the shares until the market corrects itself. We don't have analyst forecasts, but you might want to assess this data-rich visualization of earnings, revenue and cash flow.
Of course you might be able to find a better stock than European Reliance General Insurance. So you may wish to see this free collection of other companies that have grown earnings strongly.
We aim to bring you long-term focused research analysis driven by fundamental data. Note that our analysis may not factor in the latest price-sensitive company announcements or qualitative material.
If you spot an error that warrants correction, please contact the editor at editorial-team@simplywallst.com. This article by Simply Wall St is general in nature. It does not constitute a recommendation to buy or sell any stock, and does not take account of your objectives, or your financial situation. Simply Wall St has no position in the stocks mentioned. Thank you for reading.

