Do You Know What Global EcoPower Société Anonyme's (EPA:ALGEP) P/E Ratio Means?

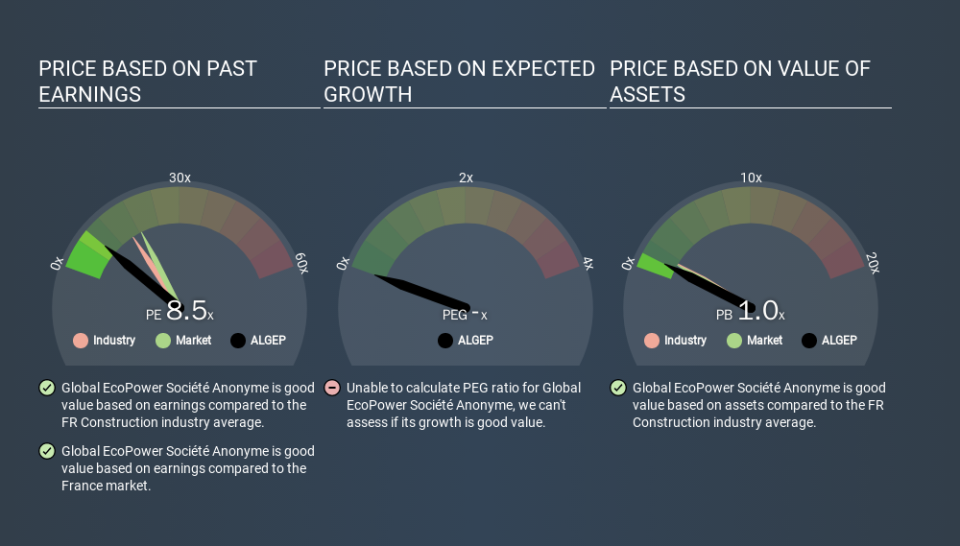
The goal of this article is to teach you how to use price to earnings ratios (P/E ratios). To keep it practical, we'll show how Global EcoPower Société Anonyme's (EPA:ALGEP) P/E ratio could help you assess the value on offer. Looking at earnings over the last twelve months, Global EcoPower Société Anonyme has a P/E ratio of 8.49. That corresponds to an earnings yield of approximately 11.8%.
Check out our latest analysis for Global EcoPower Société Anonyme
How Do I Calculate A Price To Earnings Ratio?
The formula for P/E is:
Price to Earnings Ratio = Price per Share ÷ Earnings per Share (EPS)
Or for Global EcoPower Société Anonyme:
P/E of 8.49 = EUR1.69 ÷ EUR0.20 (Based on the trailing twelve months to June 2019.)
Is A High Price-to-Earnings Ratio Good?
A higher P/E ratio means that buyers have to pay a higher price for each EUR1 the company has earned over the last year. That isn't necessarily good or bad, but a high P/E implies relatively high expectations of what a company can achieve in the future.
Does Global EcoPower Société Anonyme Have A Relatively High Or Low P/E For Its Industry?
The P/E ratio essentially measures market expectations of a company. The image below shows that Global EcoPower Société Anonyme has a lower P/E than the average (15.8) P/E for companies in the construction industry.
Global EcoPower Société Anonyme's P/E tells us that market participants think it will not fare as well as its peers in the same industry. Many investors like to buy stocks when the market is pessimistic about their prospects. If you consider the stock interesting, further research is recommended. For example, I often monitor director buying and selling.
How Growth Rates Impact P/E Ratios
P/E ratios primarily reflect market expectations around earnings growth rates. That's because companies that grow earnings per share quickly will rapidly increase the 'E' in the equation. That means unless the share price increases, the P/E will reduce in a few years. So while a stock may look expensive based on past earnings, it could be cheap based on future earnings.
Global EcoPower Société Anonyme's earnings per share fell by 5.3% in the last twelve months. But EPS is up 9.3% over the last 5 years.
Remember: P/E Ratios Don't Consider The Balance Sheet
One drawback of using a P/E ratio is that it considers market capitalization, but not the balance sheet. In other words, it does not consider any debt or cash that the company may have on the balance sheet. In theory, a company can lower its future P/E ratio by using cash or debt to invest in growth.
Such spending might be good or bad, overall, but the key point here is that you need to look at debt to understand the P/E ratio in context.
So What Does Global EcoPower Société Anonyme's Balance Sheet Tell Us?
Global EcoPower Société Anonyme's net debt equates to 36% of its market capitalization. While it's worth keeping this in mind, it isn't a worry.
The Bottom Line On Global EcoPower Société Anonyme's P/E Ratio
Global EcoPower Société Anonyme's P/E is 8.5 which is below average (18.6) in the FR market. With only modest debt, it's likely the lack of EPS growth at least partially explains the pessimism implied by the P/E ratio.
Investors have an opportunity when market expectations about a stock are wrong. As value investor Benjamin Graham famously said, 'In the short run, the market is a voting machine but in the long run, it is a weighing machine. We don't have analyst forecasts, but you might want to assess this data-rich visualization of earnings, revenue and cash flow.
But note: Global EcoPower Société Anonyme may not be the best stock to buy. So take a peek at this free list of interesting companies with strong recent earnings growth (and a P/E ratio below 20).
If you spot an error that warrants correction, please contact the editor at editorial-team@simplywallst.com. This article by Simply Wall St is general in nature. It does not constitute a recommendation to buy or sell any stock, and does not take account of your objectives, or your financial situation. Simply Wall St has no position in the stocks mentioned.
We aim to bring you long-term focused research analysis driven by fundamental data. Note that our analysis may not factor in the latest price-sensitive company announcements or qualitative material. Thank you for reading.
