Do You Know What Haulotte Group SA's (EPA:PIG) P/E Ratio Means?

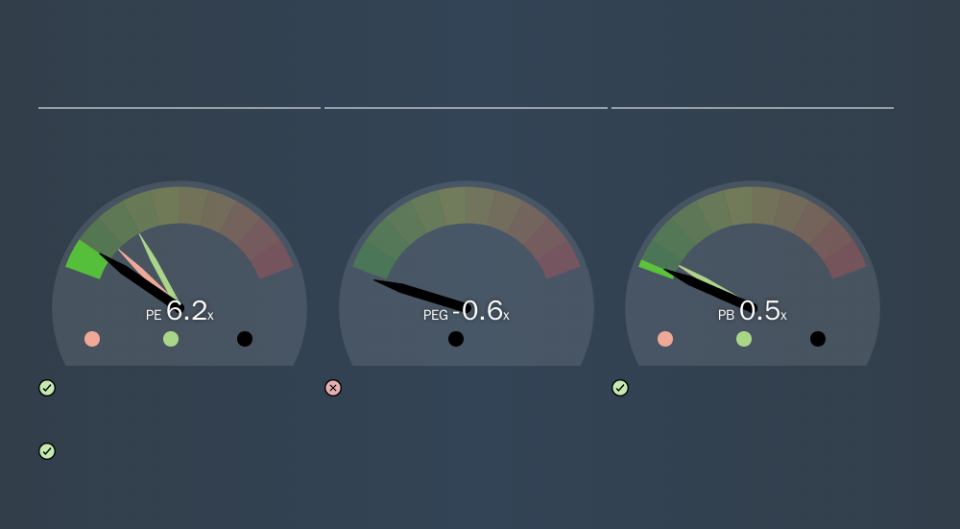
This article is written for those who want to get better at using price to earnings ratios (P/E ratios). We'll apply a basic P/E ratio analysis to Haulotte Group SA's (EPA:PIG), to help you decide if the stock is worth further research. What is Haulotte Group's P/E ratio? Well, based on the last twelve months it is 6.19. That is equivalent to an earnings yield of about 16.1%.
See our latest analysis for Haulotte Group
How Do I Calculate A Price To Earnings Ratio?
The formula for P/E is:
Price to Earnings Ratio = Share Price ÷ Earnings per Share (EPS)
Or for Haulotte Group:
P/E of 6.19 = €4.83 ÷ €0.78 (Based on the trailing twelve months to June 2019.)
Is A High P/E Ratio Good?
The higher the P/E ratio, the higher the price tag of a business, relative to its trailing earnings. That is not a good or a bad thing per se, but a high P/E does imply buyers are optimistic about the future.
How Does Haulotte Group's P/E Ratio Compare To Its Peers?
We can get an indication of market expectations by looking at the P/E ratio. We can see in the image below that the average P/E (10.0) for companies in the machinery industry is higher than Haulotte Group's P/E.
This suggests that market participants think Haulotte Group will underperform other companies in its industry. While current expectations are low, the stock could be undervalued if the situation is better than the market assumes. You should delve deeper. I like to check if company insiders have been buying or selling.
How Growth Rates Impact P/E Ratios
Generally speaking the rate of earnings growth has a profound impact on a company's P/E multiple. That's because companies that grow earnings per share quickly will rapidly increase the 'E' in the equation. And in that case, the P/E ratio itself will drop rather quickly. And as that P/E ratio drops, the company will look cheap, unless its share price increases.
Haulotte Group saw earnings per share decrease by 4.6% last year. But over the longer term (5 years) earnings per share have increased by 26%.
Remember: P/E Ratios Don't Consider The Balance Sheet
One drawback of using a P/E ratio is that it considers market capitalization, but not the balance sheet. So it won't reflect the advantage of cash, or disadvantage of debt. Theoretically, a business can improve its earnings (and produce a lower P/E in the future) by investing in growth. That means taking on debt (or spending its cash).
Such expenditure might be good or bad, in the long term, but the point here is that the balance sheet is not reflected by this ratio.
How Does Haulotte Group's Debt Impact Its P/E Ratio?
Net debt totals 92% of Haulotte Group's market cap. This is a reasonably significant level of debt -- all else being equal you'd expect a much lower P/E than if it had net cash.
The Bottom Line On Haulotte Group's P/E Ratio
Haulotte Group's P/E is 6.2 which is below average (17.8) in the FR market. Given meaningful debt, and a lack of recent growth, the market looks to be extrapolating this recent performance; reflecting low expectations for the future.
Investors have an opportunity when market expectations about a stock are wrong. As value investor Benjamin Graham famously said, 'In the short run, the market is a voting machine but in the long run, it is a weighing machine. So this free visualization of the analyst consensus on future earnings could help you make the right decision about whether to buy, sell, or hold.
Of course you might be able to find a better stock than Haulotte Group. So you may wish to see this free collection of other companies that have grown earnings strongly.
We aim to bring you long-term focused research analysis driven by fundamental data. Note that our analysis may not factor in the latest price-sensitive company announcements or qualitative material.
If you spot an error that warrants correction, please contact the editor at editorial-team@simplywallst.com. This article by Simply Wall St is general in nature. It does not constitute a recommendation to buy or sell any stock, and does not take account of your objectives, or your financial situation. Simply Wall St has no position in the stocks mentioned. Thank you for reading.

