Do You Know What Honworld Group Limited's (HKG:2226) P/E Ratio Means?

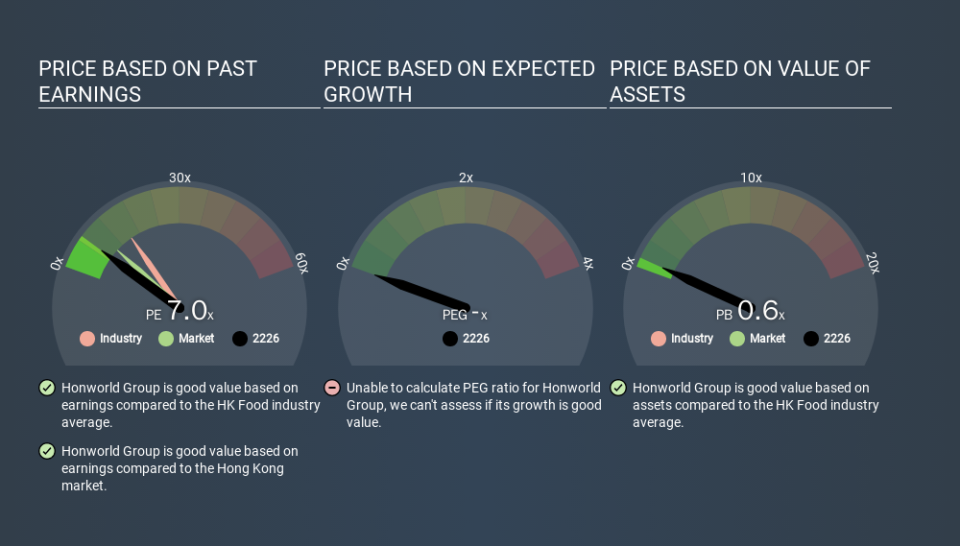
Today, we'll introduce the concept of the P/E ratio for those who are learning about investing. We'll look at Honworld Group Limited's (HKG:2226) P/E ratio and reflect on what it tells us about the company's share price. Honworld Group has a price to earnings ratio of 7.04, based on the last twelve months. That is equivalent to an earnings yield of about 14.2%.
Check out our latest analysis for Honworld Group
How Do You Calculate A P/E Ratio?
The formula for price to earnings is:
Price to Earnings Ratio = Share Price (in reporting currency) ÷ Earnings per Share (EPS)
Or for Honworld Group:
P/E of 7.04 = CNY2.54 (Note: this is the share price in the reporting currency, namely, CNY ) ÷ CNY0.36 (Based on the year to June 2019.)
Is A High Price-to-Earnings Ratio Good?
A higher P/E ratio implies that investors pay a higher price for the earning power of the business. That isn't necessarily good or bad, but a high P/E implies relatively high expectations of what a company can achieve in the future.
How Does Honworld Group's P/E Ratio Compare To Its Peers?
We can get an indication of market expectations by looking at the P/E ratio. We can see in the image below that the average P/E (15.2) for companies in the food industry is higher than Honworld Group's P/E.
Honworld Group's P/E tells us that market participants think it will not fare as well as its peers in the same industry. Many investors like to buy stocks when the market is pessimistic about their prospects. It is arguably worth checking if insiders are buying shares, because that might imply they believe the stock is undervalued.
How Growth Rates Impact P/E Ratios
Companies that shrink earnings per share quickly will rapidly decrease the 'E' in the equation. That means unless the share price falls, the P/E will increase in a few years. A higher P/E should indicate the stock is expensive relative to others -- and that may encourage shareholders to sell.
Honworld Group saw earnings per share improve by -6.4% last year. Unfortunately, earnings per share are down 4.0% a year, over 5 years.
A Limitation: P/E Ratios Ignore Debt and Cash In The Bank
One drawback of using a P/E ratio is that it considers market capitalization, but not the balance sheet. Thus, the metric does not reflect cash or debt held by the company. Theoretically, a business can improve its earnings (and produce a lower P/E in the future) by investing in growth. That means taking on debt (or spending its cash).
Spending on growth might be good or bad a few years later, but the point is that the P/E ratio does not account for the option (or lack thereof).
How Does Honworld Group's Debt Impact Its P/E Ratio?
Net debt is 35% of Honworld Group's market cap. While it's worth keeping this in mind, it isn't a worry.
The Bottom Line On Honworld Group's P/E Ratio
Honworld Group's P/E is 7.0 which is below average (9.8) in the HK market. The company does have a little debt, and EPS is moving in the right direction. If you believe growth will continue - or even increase - then the low P/E may signify opportunity.
Investors have an opportunity when market expectations about a stock are wrong. As value investor Benjamin Graham famously said, 'In the short run, the market is a voting machine but in the long run, it is a weighing machine. We don't have analyst forecasts, but shareholders might want to examine this detailed historical graph of earnings, revenue and cash flow.
You might be able to find a better buy than Honworld Group. If you want a selection of possible winners, check out this free list of interesting companies that trade on a P/E below 20 (but have proven they can grow earnings).
If you spot an error that warrants correction, please contact the editor at editorial-team@simplywallst.com. This article by Simply Wall St is general in nature. It does not constitute a recommendation to buy or sell any stock, and does not take account of your objectives, or your financial situation. Simply Wall St has no position in the stocks mentioned.
We aim to bring you long-term focused research analysis driven by fundamental data. Note that our analysis may not factor in the latest price-sensitive company announcements or qualitative material. Thank you for reading.

