Do You Know What Kingboard Laminates Holdings Limited's (HKG:1888) P/E Ratio Means?

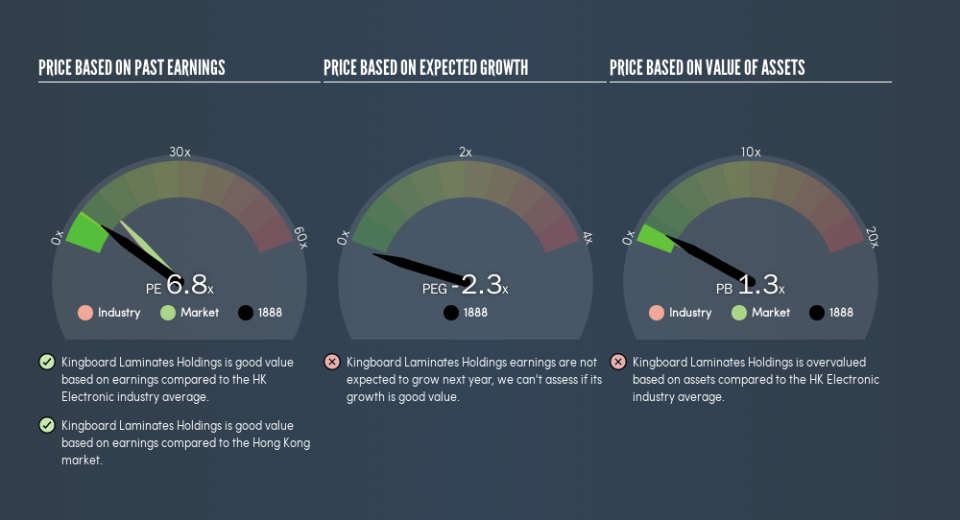
This article is for investors who would like to improve their understanding of price to earnings ratios (P/E ratios). We'll apply a basic P/E ratio analysis to Kingboard Laminates Holdings Limited's (HKG:1888), to help you decide if the stock is worth further research. Kingboard Laminates Holdings has a P/E ratio of 6.82, based on the last twelve months. That corresponds to an earnings yield of approximately 15%.
Want to participate in a short research study? Help shape the future of investing tools and you could win a $250 gift card!
Check out our latest analysis for Kingboard Laminates Holdings
How Do I Calculate Kingboard Laminates Holdings's Price To Earnings Ratio?
The formula for P/E is:
Price to Earnings Ratio = Price per Share ÷ Earnings per Share (EPS)
Or for Kingboard Laminates Holdings:
P/E of 6.82 = HK$7.19 ÷ HK$1.05 (Based on the year to December 2018.)
Is A High Price-to-Earnings Ratio Good?
A higher P/E ratio means that buyers have to pay a higher price for each HK$1 the company has earned over the last year. All else being equal, it's better to pay a low price -- but as Warren Buffett said, 'It's far better to buy a wonderful company at a fair price than a fair company at a wonderful price.'
How Growth Rates Impact P/E Ratios
P/E ratios primarily reflect market expectations around earnings growth rates. Earnings growth means that in the future the 'E' will be higher. Therefore, even if you pay a high multiple of earnings now, that multiple will become lower in the future. And as that P/E ratio drops, the company will look cheap, unless its share price increases.
Kingboard Laminates Holdings shrunk earnings per share by 14% over the last year. But it has grown its earnings per share by 21% per year over the last five years.
How Does Kingboard Laminates Holdings's P/E Ratio Compare To Its Peers?
We can get an indication of market expectations by looking at the P/E ratio. The image below shows that Kingboard Laminates Holdings has a lower P/E than the average (11) P/E for companies in the electronic industry.
This suggests that market participants think Kingboard Laminates Holdings will underperform other companies in its industry. While current expectations are low, the stock could be undervalued if the situation is better than the market assumes. If you consider the stock interesting, further research is recommended. For example, I often monitor director buying and selling.
A Limitation: P/E Ratios Ignore Debt and Cash In The Bank
Don't forget that the P/E ratio considers market capitalization. So it won't reflect the advantage of cash, or disadvantage of debt. Hypothetically, a company could reduce its future P/E ratio by spending its cash (or taking on debt) to achieve higher earnings.
While growth expenditure doesn't always pay off, the point is that it is a good option to have; but one that the P/E ratio ignores.
Is Debt Impacting Kingboard Laminates Holdings's P/E?
Kingboard Laminates Holdings's net debt is 9.0% of its market cap. It would probably trade on a higher P/E ratio if it had a lot of cash, but I doubt it is having a big impact.
The Verdict On Kingboard Laminates Holdings's P/E Ratio
Kingboard Laminates Holdings's P/E is 6.8 which is below average (11.3) in the HK market. With only modest debt, it's likely the lack of EPS growth at least partially explains the pessimism implied by the P/E ratio.
Investors should be looking to buy stocks that the market is wrong about. If it is underestimating a company, investors can make money by buying and holding the shares until the market corrects itself. So this free visualization of the analyst consensus on future earnings could help you make the right decision about whether to buy, sell, or hold.
Of course you might be able to find a better stock than Kingboard Laminates Holdings. So you may wish to see this free collection of other companies that have grown earnings strongly.
We aim to bring you long-term focused research analysis driven by fundamental data. Note that our analysis may not factor in the latest price-sensitive company announcements or qualitative material.
If you spot an error that warrants correction, please contact the editor at editorial-team@simplywallst.com. This article by Simply Wall St is general in nature. It does not constitute a recommendation to buy or sell any stock, and does not take account of your objectives, or your financial situation. Simply Wall St has no position in the stocks mentioned. Thank you for reading.
