Do You Know What Komax Holding AG's (VTX:KOMN) P/E Ratio Means?

Want to participate in a short research study? Help shape the future of investing tools and you could win a $250 gift card!
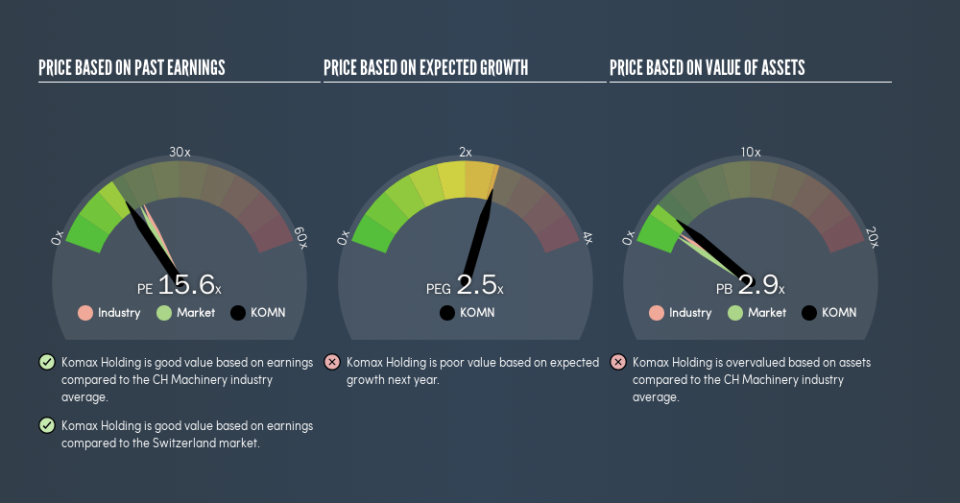
This article is written for those who want to get better at using price to earnings ratios (P/E ratios). We'll show how you can use Komax Holding AG's (VTX:KOMN) P/E ratio to inform your assessment of the investment opportunity. What is Komax Holding's P/E ratio? Well, based on the last twelve months it is 15.58. That means that at current prices, buyers pay CHF15.58 for every CHF1 in trailing yearly profits.
See our latest analysis for Komax Holding
How Do I Calculate A Price To Earnings Ratio?
The formula for P/E is:
Price to Earnings Ratio = Price per Share ÷ Earnings per Share (EPS)
Or for Komax Holding:
P/E of 15.58 = CHF210.6 ÷ CHF13.52 (Based on the trailing twelve months to December 2018.)
Is A High Price-to-Earnings Ratio Good?
A higher P/E ratio means that investors are paying a higher price for each CHF1 of company earnings. That isn't necessarily good or bad, but a high P/E implies relatively high expectations of what a company can achieve in the future.
How Growth Rates Impact P/E Ratios
Earnings growth rates have a big influence on P/E ratios. When earnings grow, the 'E' increases, over time. That means even if the current P/E is high, it will reduce over time if the share price stays flat. A lower P/E should indicate the stock is cheap relative to others -- and that may attract buyers.
Komax Holding increased earnings per share by an impressive 22% over the last twelve months. And it has bolstered its earnings per share by 5.8% per year over the last five years. So one might expect an above average P/E ratio.
How Does Komax Holding's P/E Ratio Compare To Its Peers?
We can get an indication of market expectations by looking at the P/E ratio. We can see in the image below that the average P/E (19.5) for companies in the machinery industry is higher than Komax Holding's P/E.
Its relatively low P/E ratio indicates that Komax Holding shareholders think it will struggle to do as well as other companies in its industry classification. While current expectations are low, the stock could be undervalued if the situation is better than the market assumes. If you consider the stock interesting, further research is recommended. For example, I often monitor director buying and selling.
Don't Forget: The P/E Does Not Account For Debt or Bank Deposits
The 'Price' in P/E reflects the market capitalization of the company. Thus, the metric does not reflect cash or debt held by the company. In theory, a company can lower its future P/E ratio by using cash or debt to invest in growth.
While growth expenditure doesn't always pay off, the point is that it is a good option to have; but one that the P/E ratio ignores.
Is Debt Impacting Komax Holding's P/E?
Komax Holding has net debt worth just 4.9% of its market capitalization. So it doesn't have as many options as it would with net cash, but its debt would not have much of an impact on its P/E ratio.
The Verdict On Komax Holding's P/E Ratio
Komax Holding trades on a P/E ratio of 15.6, which is below the CH market average of 18.4. The EPS growth last year was strong, and debt levels are quite reasonable. If the company can continue to grow earnings, then the current P/E may be unjustifiably low.
Investors should be looking to buy stocks that the market is wrong about. If the reality for a company is not as bad as the P/E ratio indicates, then the share price should increase as the market realizes this. So this free visualization of the analyst consensus on future earnings could help you make the right decision about whether to buy, sell, or hold.
Of course you might be able to find a better stock than Komax Holding. So you may wish to see this free collection of other companies that have grown earnings strongly.
We aim to bring you long-term focused research analysis driven by fundamental data. Note that our analysis may not factor in the latest price-sensitive company announcements or qualitative material.
If you spot an error that warrants correction, please contact the editor at editorial-team@simplywallst.com. This article by Simply Wall St is general in nature. It does not constitute a recommendation to buy or sell any stock, and does not take account of your objectives, or your financial situation. Simply Wall St has no position in the stocks mentioned. Thank you for reading.

