Do You Know About M/I Homes, Inc.’s (NYSE:MHO) ROCE?

Today we are going to look at M/I Homes, Inc. (NYSE:MHO) to see whether it might be an attractive investment prospect. In particular, we'll consider its Return On Capital Employed (ROCE), as that can give us insight into how profitably the company is able to employ capital in its business.
First, we'll go over how we calculate ROCE. Second, we'll look at its ROCE compared to similar companies. Last but not least, we'll look at what impact its current liabilities have on its ROCE.
Return On Capital Employed (ROCE): What is it?
ROCE measures the 'return' (pre-tax profit) a company generates from capital employed in its business. Generally speaking a higher ROCE is better. Ultimately, it is a useful but imperfect metric. Author Edwin Whiting says to be careful when comparing the ROCE of different businesses, since 'No two businesses are exactly alike.
So, How Do We Calculate ROCE?
The formula for calculating the return on capital employed is:
Return on Capital Employed = Earnings Before Interest and Tax (EBIT) ÷ (Total Assets - Current Liabilities)
Or for M/I Homes:
0.099 = US$184m ÷ (US$2.2b - US$310m) (Based on the trailing twelve months to September 2019.)
So, M/I Homes has an ROCE of 9.9%.
See our latest analysis for M/I Homes
Is M/I Homes's ROCE Good?
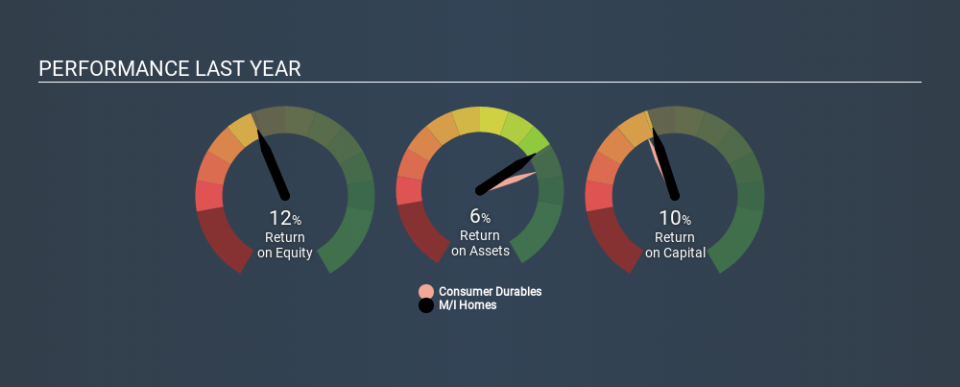
When making comparisons between similar businesses, investors may find ROCE useful. We can see M/I Homes's ROCE is around the 12% average reported by the Consumer Durables industry. Independently of how M/I Homes compares to its industry, its ROCE in absolute terms appears decent, and the company may be worthy of closer investigation.
You can click on the image below to see (in greater detail) how M/I Homes's past growth compares to other companies.
When considering ROCE, bear in mind that it reflects the past and does not necessarily predict the future. ROCE can be deceptive for cyclical businesses, as returns can look incredible in boom times, and terribly low in downturns. ROCE is only a point-in-time measure. What happens in the future is pretty important for investors, so we have prepared a free report on analyst forecasts for M/I Homes.
What Are Current Liabilities, And How Do They Affect M/I Homes's ROCE?
Liabilities, such as supplier bills and bank overdrafts, are referred to as current liabilities if they need to be paid within 12 months. Due to the way the ROCE equation works, having large bills due in the near term can make it look as though a company has less capital employed, and thus a higher ROCE than usual. To counter this, investors can check if a company has high current liabilities relative to total assets.
M/I Homes has total liabilities of US$310m and total assets of US$2.2b. As a result, its current liabilities are equal to approximately 14% of its total assets. Low current liabilities are not boosting the ROCE too much.
The Bottom Line On M/I Homes's ROCE
With that in mind, M/I Homes's ROCE appears pretty good. M/I Homes looks strong on this analysis, but there are plenty of other companies that could be a good opportunity . Here is a free list of companies growing earnings rapidly.
If you are like me, then you will not want to miss this free list of growing companies that insiders are buying.
If you spot an error that warrants correction, please contact the editor at editorial-team@simplywallst.com. This article by Simply Wall St is general in nature. It does not constitute a recommendation to buy or sell any stock, and does not take account of your objectives, or your financial situation. Simply Wall St has no position in the stocks mentioned.
We aim to bring you long-term focused research analysis driven by fundamental data. Note that our analysis may not factor in the latest price-sensitive company announcements or qualitative material. Thank you for reading.
