Do You Know What National HealthCare Corporation's (NYSEMKT:NHC) P/E Ratio Means?

Want to participate in a short research study? Help shape the future of investing tools and you could win a $250 gift card!
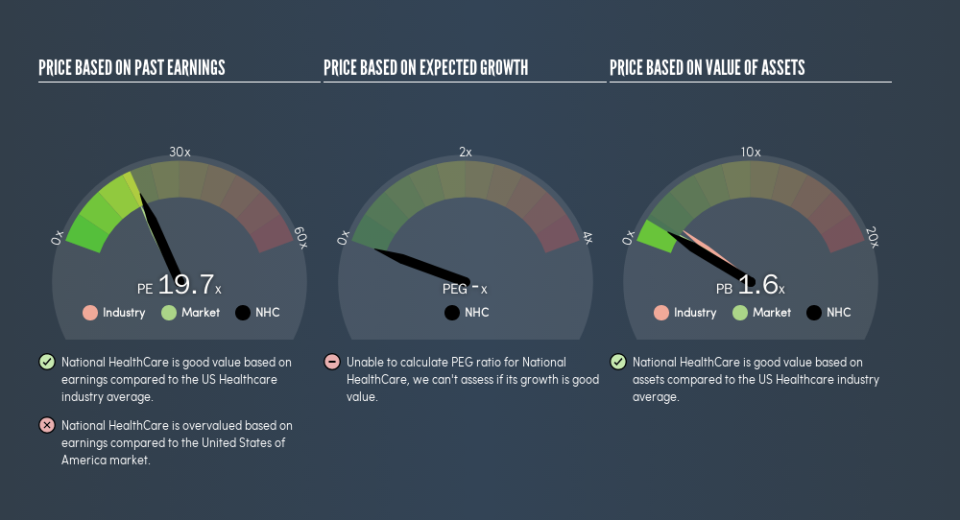
The goal of this article is to teach you how to use price to earnings ratios (P/E ratios). We'll look at National HealthCare Corporation's (NYSEMKT:NHC) P/E ratio and reflect on what it tells us about the company's share price. Looking at earnings over the last twelve months, National HealthCare has a P/E ratio of 19.73. That corresponds to an earnings yield of approximately 5.1%.
See our latest analysis for National HealthCare
How Do I Calculate A Price To Earnings Ratio?
The formula for price to earnings is:
Price to Earnings Ratio = Price per Share ÷ Earnings per Share (EPS)
Or for National HealthCare:
P/E of 19.73 = $76.41 ÷ $3.87 (Based on the trailing twelve months to December 2018.)
Is A High Price-to-Earnings Ratio Good?
A higher P/E ratio implies that investors pay a higher price for the earning power of the business. That is not a good or a bad thing per se, but a high P/E does imply buyers are optimistic about the future.
How Growth Rates Impact P/E Ratios
P/E ratios primarily reflect market expectations around earnings growth rates. When earnings grow, the 'E' increases, over time. That means unless the share price increases, the P/E will reduce in a few years. So while a stock may look expensive based on past earnings, it could be cheap based on future earnings.
National HealthCare saw earnings per share improve by -4.7% last year. And it has improved its earnings per share by 5.1% per year over the last three years.
How Does National HealthCare's P/E Ratio Compare To Its Peers?
The P/E ratio essentially measures market expectations of a company. As you can see below National HealthCare has a P/E ratio that is fairly close for the average for the healthcare industry, which is 20.1.
Its P/E ratio suggests that National HealthCare shareholders think that in the future it will perform about the same as other companies in its industry classification. So if National HealthCare actually outperforms its peers going forward, that should be a positive for the share price. Further research into factors such asmanagement tenure, could help you form your own view on whether that is likely.
Don't Forget: The P/E Does Not Account For Debt or Bank Deposits
The 'Price' in P/E reflects the market capitalization of the company. Thus, the metric does not reflect cash or debt held by the company. In theory, a company can lower its future P/E ratio by using cash or debt to invest in growth.
Spending on growth might be good or bad a few years later, but the point is that the P/E ratio does not account for the option (or lack thereof).
So What Does National HealthCare's Balance Sheet Tell Us?
National HealthCare has net cash of US$105m. That should lead to a higher P/E than if it did have debt, because its strong balance sheets gives it more options.
The Bottom Line On National HealthCare's P/E Ratio
National HealthCare trades on a P/E ratio of 19.7, which is fairly close to the US market average of 18.4. Recent earnings growth wasn't bad. Also positive, the relatively strong balance sheet will allow for investment in growth. If this occurs the current P/E might prove to signify undervaluation.
Investors should be looking to buy stocks that the market is wrong about. As value investor Benjamin Graham famously said, 'In the short run, the market is a voting machine but in the long run, it is a weighing machine.' Although we don't have analyst forecasts, shareholders might want to examine this detailed historical graph of earnings, revenue and cash flow.
Of course, you might find a fantastic investment by looking at a few good candidates. So take a peek at this free list of companies with modest (or no) debt, trading on a P/E below 20.
We aim to bring you long-term focused research analysis driven by fundamental data. Note that our analysis may not factor in the latest price-sensitive company announcements or qualitative material.
If you spot an error that warrants correction, please contact the editor at editorial-team@simplywallst.com. This article by Simply Wall St is general in nature. It does not constitute a recommendation to buy or sell any stock, and does not take account of your objectives, or your financial situation. Simply Wall St has no position in the stocks mentioned. Thank you for reading.

