Do You Know What OVB Holding AG's (ETR:O4B) P/E Ratio Means?

Today, we'll introduce the concept of the P/E ratio for those who are learning about investing. To keep it practical, we'll show how OVB Holding AG's (ETR:O4B) P/E ratio could help you assess the value on offer. What is OVB Holding's P/E ratio? Well, based on the last twelve months it is 22.90. That corresponds to an earnings yield of approximately 4.4%.
View our latest analysis for OVB Holding
How Do You Calculate A P/E Ratio?
The formula for P/E is:
Price to Earnings Ratio = Price per Share ÷ Earnings per Share (EPS)
Or for OVB Holding:
P/E of 22.90 = €16.90 ÷ €0.74 (Based on the trailing twelve months to June 2019.)
Is A High Price-to-Earnings Ratio Good?
A higher P/E ratio means that buyers have to pay a higher price for each €1 the company has earned over the last year. That is not a good or a bad thing per se, but a high P/E does imply buyers are optimistic about the future.
Does OVB Holding Have A Relatively High Or Low P/E For Its Industry?
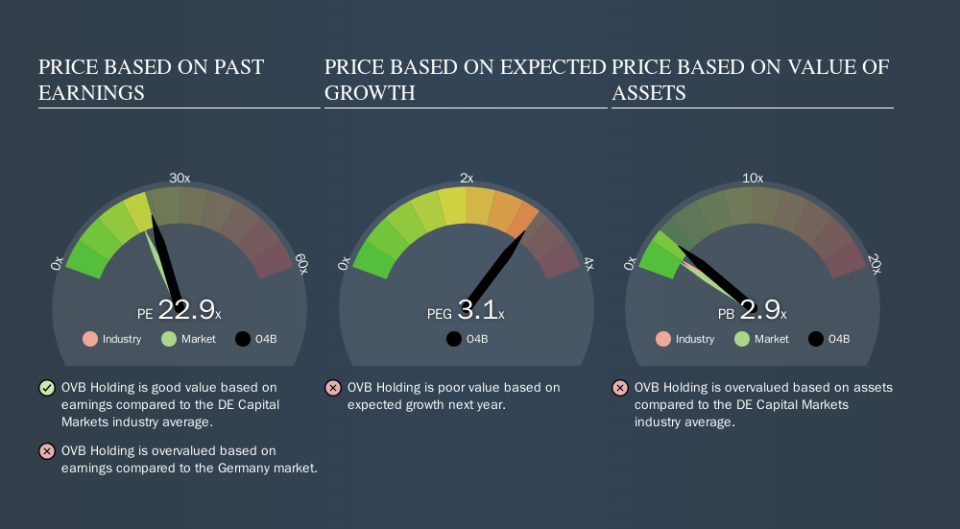
One good way to get a quick read on what market participants expect of a company is to look at its P/E ratio. The image below shows that OVB Holding has a P/E ratio that is roughly in line with the capital markets industry average (22.9).
Its P/E ratio suggests that OVB Holding shareholders think that in the future it will perform about the same as other companies in its industry classification. So if OVB Holding actually outperforms its peers going forward, that should be a positive for the share price. Further research into factors such as insider buying and selling, could help you form your own view on whether that is likely.
How Growth Rates Impact P/E Ratios
If earnings fall then in the future the 'E' will be lower. Therefore, even if you pay a low multiple of earnings now, that multiple will become higher in the future. A higher P/E should indicate the stock is expensive relative to others -- and that may encourage shareholders to sell.
OVB Holding had pretty flat EPS growth in the last year. But it has grown its earnings per share by 3.4% per year over the last five years. And over the longer term (3 years) earnings per share have decreased 2.5% annually. So it would be surprising to see a high P/E.
Remember: P/E Ratios Don't Consider The Balance Sheet
It's important to note that the P/E ratio considers the market capitalization, not the enterprise value. In other words, it does not consider any debt or cash that the company may have on the balance sheet. In theory, a company can lower its future P/E ratio by using cash or debt to invest in growth.
Such expenditure might be good or bad, in the long term, but the point here is that the balance sheet is not reflected by this ratio.
How Does OVB Holding's Debt Impact Its P/E Ratio?
With net cash of €89m, OVB Holding has a very strong balance sheet, which may be important for its business. Having said that, at 37% of its market capitalization the cash hoard would contribute towards a higher P/E ratio.
The Bottom Line On OVB Holding's P/E Ratio
OVB Holding's P/E is 22.9 which is above average (19.5) in its market. EPS was up modestly better over the last twelve months. And the net cash position provides the company with multiple options. The high P/E suggests the market thinks further growth will come.
When the market is wrong about a stock, it gives savvy investors an opportunity. People often underestimate remarkable growth -- so investors can make money when fast growth is not fully appreciated. So this free visual report on analyst forecasts could hold the key to an excellent investment decision.
Of course you might be able to find a better stock than OVB Holding. So you may wish to see this free collection of other companies that have grown earnings strongly.
We aim to bring you long-term focused research analysis driven by fundamental data. Note that our analysis may not factor in the latest price-sensitive company announcements or qualitative material.
If you spot an error that warrants correction, please contact the editor at editorial-team@simplywallst.com. This article by Simply Wall St is general in nature. It does not constitute a recommendation to buy or sell any stock, and does not take account of your objectives, or your financial situation. Simply Wall St has no position in the stocks mentioned. Thank you for reading.

