Do You Know What ProSiebenSat.1 Media SE’s (ETR:PSM) P/E Ratio Means?

This article is for investors who would like to improve their understanding of price to earnings ratios (P/E ratios). We’ll look at ProSiebenSat.1 Media SE’s (ETR:PSM) P/E ratio and reflect on what it tells us about the company’s share price. Based on the last twelve months, ProSiebenSat.1 Media’s P/E ratio is 7.74. In other words, at today’s prices, investors are paying €7.74 for every €1 in prior year profit.
View our latest analysis for ProSiebenSat.1 Media
Want to help shape the future of investing tools and platforms? Take the survey and be part of one of the most advanced studies of stock market investors to date.
How Do I Calculate A Price To Earnings Ratio?
The formula for price to earnings is:
Price to Earnings Ratio = Price per Share ÷ Earnings per Share (EPS)
Or for ProSiebenSat.1 Media:
P/E of 7.74 = €15.08 ÷ €1.95 (Based on the trailing twelve months to September 2018.)
Is A High Price-to-Earnings Ratio Good?
A higher P/E ratio implies that investors pay a higher price for the earning power of the business. That isn’t a good or a bad thing on its own, but a high P/E means that buyers have a higher opinion of the business’s prospects, relative to stocks with a lower P/E.
How Growth Rates Impact P/E Ratios
Earnings growth rates have a big influence on P/E ratios. That’s because companies that grow earnings per share quickly will rapidly increase the ‘E’ in the equation. Therefore, even if you pay a high multiple of earnings now, that multiple will become lower in the future. A lower P/E should indicate the stock is cheap relative to others — and that may attract buyers.
ProSiebenSat.1 Media’s earnings per share fell by 7.3% in the last twelve months. But EPS is up 3.6% over the last 5 years.
How Does ProSiebenSat.1 Media’s P/E Ratio Compare To Its Peers?
The P/E ratio essentially measures market expectations of a company. The image below shows that ProSiebenSat.1 Media has a lower P/E than the average (24.7) P/E for companies in the media industry.
This suggests that market participants think ProSiebenSat.1 Media will underperform other companies in its industry. While current expectations are low, the stock could be undervalued if the situation is better than the market assumes. It is arguably worth checking if insiders are buying shares, because that might imply they believe the stock is undervalued.
A Limitation: P/E Ratios Ignore Debt and Cash In The Bank
The ‘Price’ in P/E reflects the market capitalization of the company. That means it doesn’t take debt or cash into account. Theoretically, a business can improve its earnings (and produce a lower P/E in the future), by taking on debt (or spending its remaining cash).
Such spending might be good or bad, overall, but the key point here is that you need to look at debt to understand the P/E ratio in context.
How Does ProSiebenSat.1 Media’s Debt Impact Its P/E Ratio?
ProSiebenSat.1 Media has net debt worth 64% of its market capitalization. This is enough debt that you’d have to make some adjustments before using the P/E ratio to compare it to a company with net cash.
The Bottom Line On ProSiebenSat.1 Media’s P/E Ratio
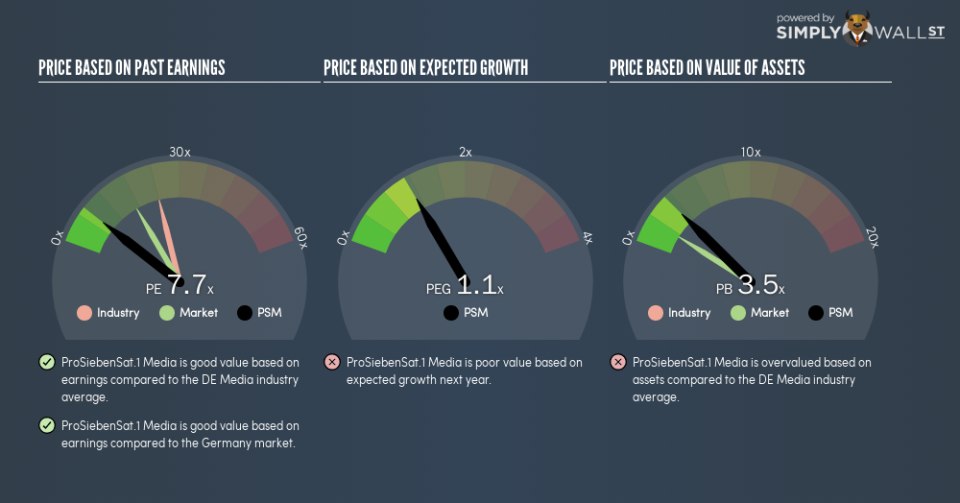
ProSiebenSat.1 Media trades on a P/E ratio of 7.7, which is below the DE market average of 16.9. Given meaningful debt, and a lack of recent growth, the market looks to be extrapolating this recent performance; reflecting low expectations for the future.
Investors should be looking to buy stocks that the market is wrong about. If the reality for a company is not as bad as the P/E ratio indicates, then the share price should increase as the market realizes this. So this free report on the analyst consensus forecasts could help you make a master move on this stock.
Of course, you might find a fantastic investment by looking at a few good candidates. So take a peek at this free list of companies with modest (or no) debt, trading on a P/E below 20.
To help readers see past the short term volatility of the financial market, we aim to bring you a long-term focused research analysis purely driven by fundamental data. Note that our analysis does not factor in the latest price-sensitive company announcements.
The author is an independent contributor and at the time of publication had no position in the stocks mentioned. For errors that warrant correction please contact the editor at editorial-team@simplywallst.com.

