Do You Know What Rocky Mountain Chocolate Factory, Inc.'s (NASDAQ:RMCF) P/E Ratio Means?

This article is written for those who want to get better at using price to earnings ratios (P/E ratios). We'll apply a basic P/E ratio analysis to Rocky Mountain Chocolate Factory, Inc.'s (NASDAQ:RMCF), to help you decide if the stock is worth further research. Rocky Mountain Chocolate Factory has a P/E ratio of 23.42, based on the last twelve months. That is equivalent to an earnings yield of about 4.3%.
View our latest analysis for Rocky Mountain Chocolate Factory
How Do I Calculate A Price To Earnings Ratio?
The formula for price to earnings is:
Price to Earnings Ratio = Price per Share ÷ Earnings per Share (EPS)
Or for Rocky Mountain Chocolate Factory:
P/E of 23.42 = $9.35 ÷ $0.40 (Based on the trailing twelve months to May 2019.)
Is A High Price-to-Earnings Ratio Good?
A higher P/E ratio means that investors are paying a higher price for each $1 of company earnings. That is not a good or a bad thing per se, but a high P/E does imply buyers are optimistic about the future.
Does Rocky Mountain Chocolate Factory Have A Relatively High Or Low P/E For Its Industry?
The P/E ratio indicates whether the market has higher or lower expectations of a company. If you look at the image below, you can see Rocky Mountain Chocolate Factory has a lower P/E than the average (26.4) in the food industry classification.
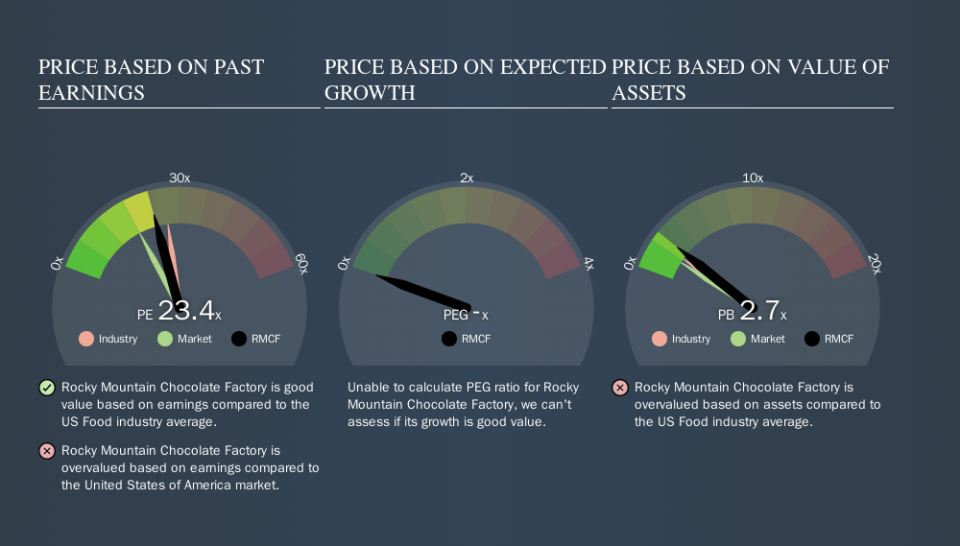
Rocky Mountain Chocolate Factory's P/E tells us that market participants think it will not fare as well as its peers in the same industry. While current expectations are low, the stock could be undervalued if the situation is better than the market assumes. It is arguably worth checking if insiders are buying shares, because that might imply they believe the stock is undervalued.
How Growth Rates Impact P/E Ratios
When earnings fall, the 'E' decreases, over time. That means unless the share price falls, the P/E will increase in a few years. So while a stock may look cheap based on past earnings, it could be expensive based on future earnings.
Rocky Mountain Chocolate Factory shrunk earnings per share by 14% over the last year. And it has shrunk its earnings per share by 9.0% per year over the last five years. This growth rate might warrant a below average P/E ratio.
Remember: P/E Ratios Don't Consider The Balance Sheet
It's important to note that the P/E ratio considers the market capitalization, not the enterprise value. Thus, the metric does not reflect cash or debt held by the company. Hypothetically, a company could reduce its future P/E ratio by spending its cash (or taking on debt) to achieve higher earnings.
Spending on growth might be good or bad a few years later, but the point is that the P/E ratio does not account for the option (or lack thereof).
So What Does Rocky Mountain Chocolate Factory's Balance Sheet Tell Us?
The extra options and safety that comes with Rocky Mountain Chocolate Factory's US$5.1m net cash position means that it deserves a higher P/E than it would if it had a lot of net debt.
The Bottom Line On Rocky Mountain Chocolate Factory's P/E Ratio
Rocky Mountain Chocolate Factory's P/E is 23.4 which is above average (18.0) in its market. The recent drop in earnings per share might keep value investors away, but the net cash position means the company has time to improve: and the high P/E suggests the market thinks it will.
Investors have an opportunity when market expectations about a stock are wrong. If the reality for a company is better than it expects, you can make money by buying and holding for the long term. Although we don't have analyst forecasts you might want to assess this data-rich visualization of earnings, revenue and cash flow.
Of course you might be able to find a better stock than Rocky Mountain Chocolate Factory. So you may wish to see this free collection of other companies that have grown earnings strongly.
We aim to bring you long-term focused research analysis driven by fundamental data. Note that our analysis may not factor in the latest price-sensitive company announcements or qualitative material.
If you spot an error that warrants correction, please contact the editor at editorial-team@simplywallst.com. This article by Simply Wall St is general in nature. It does not constitute a recommendation to buy or sell any stock, and does not take account of your objectives, or your financial situation. Simply Wall St has no position in the stocks mentioned. Thank you for reading.
