Do You Know What Tradelink Electronic Commerce Limited's (HKG:536) P/E Ratio Means?

Want to participate in a short research study? Help shape the future of investing tools and you could win a $250 gift card!
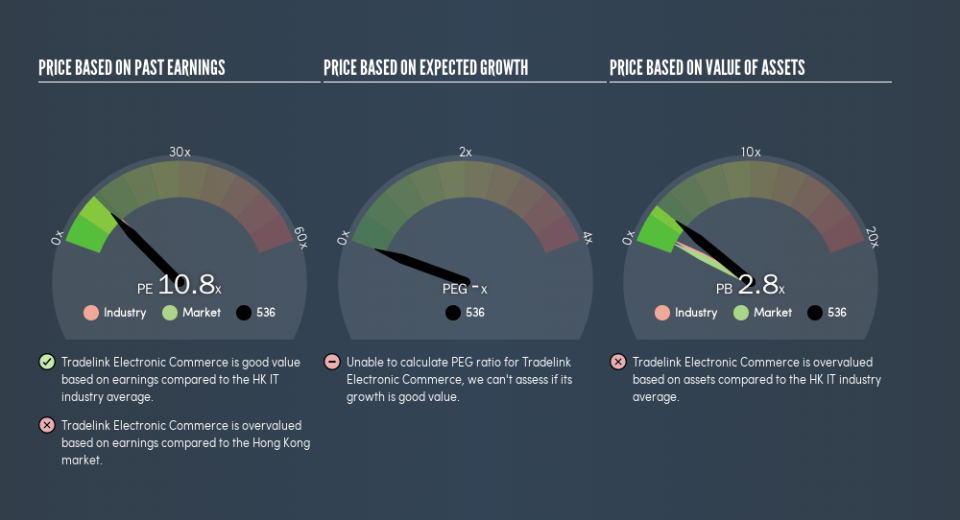
This article is for investors who would like to improve their understanding of price to earnings ratios (P/E ratios). We'll look at Tradelink Electronic Commerce Limited's (HKG:536) P/E ratio and reflect on what it tells us about the company's share price. Based on the last twelve months, Tradelink Electronic Commerce's P/E ratio is 10.8. In other words, at today's prices, investors are paying HK$10.8 for every HK$1 in prior year profit.
See our latest analysis for Tradelink Electronic Commerce
How Do I Calculate A Price To Earnings Ratio?
The formula for P/E is:
Price to Earnings Ratio = Share Price ÷ Earnings per Share (EPS)
Or for Tradelink Electronic Commerce:
P/E of 10.8 = HK$1.22 ÷ HK$0.11 (Based on the year to December 2018.)
Is A High P/E Ratio Good?
A higher P/E ratio implies that investors pay a higher price for the earning power of the business. That isn't necessarily good or bad, but a high P/E implies relatively high expectations of what a company can achieve in the future.
How Growth Rates Impact P/E Ratios
Probably the most important factor in determining what P/E a company trades on is the earnings growth. Earnings growth means that in the future the 'E' will be higher. That means unless the share price increases, the P/E will reduce in a few years. And as that P/E ratio drops, the company will look cheap, unless its share price increases.
It's great to see that Tradelink Electronic Commerce grew EPS by 21% in the last year. And it has bolstered its earnings per share by 1.5% per year over the last five years. This could arguably justify a relatively high P/E ratio.
How Does Tradelink Electronic Commerce's P/E Ratio Compare To Its Peers?
The P/E ratio indicates whether the market has higher or lower expectations of a company. We can see in the image below that the average P/E (11.7) for companies in the it industry is higher than Tradelink Electronic Commerce's P/E.
Its relatively low P/E ratio indicates that Tradelink Electronic Commerce shareholders think it will struggle to do as well as other companies in its industry classification. Many investors like to buy stocks when the market is pessimistic about their prospects. If you consider the stock interesting, further research is recommended. For example, I often monitor director buying and selling.
Remember: P/E Ratios Don't Consider The Balance Sheet
The 'Price' in P/E reflects the market capitalization of the company. In other words, it does not consider any debt or cash that the company may have on the balance sheet. Theoretically, a business can improve its earnings (and produce a lower P/E in the future) by investing in growth. That means taking on debt (or spending its cash).
Such expenditure might be good or bad, in the long term, but the point here is that the balance sheet is not reflected by this ratio.
So What Does Tradelink Electronic Commerce's Balance Sheet Tell Us?
Tradelink Electronic Commerce has net cash of HK$129m. This is fairly high at 13% of its market capitalization. That might mean balance sheet strength is important to the business, but should also help push the P/E a bit higher than it would otherwise be.
The Verdict On Tradelink Electronic Commerce's P/E Ratio
Tradelink Electronic Commerce trades on a P/E ratio of 10.8, which is fairly close to the HK market average of 10.7. Considering its recent growth, alongside its lack of debt, it would appear that the market isn't very excited about the future.
Investors have an opportunity when market expectations about a stock are wrong. As value investor Benjamin Graham famously said, 'In the short run, the market is a voting machine but in the long run, it is a weighing machine.' Although we don't have analyst forecasts, shareholders might want to examine this detailed historical graph of earnings, revenue and cash flow.
You might be able to find a better buy than Tradelink Electronic Commerce. If you want a selection of possible winners, check out this free list of interesting companies that trade on a P/E below 20 (but have proven they can grow earnings).
We aim to bring you long-term focused research analysis driven by fundamental data. Note that our analysis may not factor in the latest price-sensitive company announcements or qualitative material.
If you spot an error that warrants correction, please contact the editor at editorial-team@simplywallst.com. This article by Simply Wall St is general in nature. It does not constitute a recommendation to buy or sell any stock, and does not take account of your objectives, or your financial situation. Simply Wall St has no position in the stocks mentioned. Thank you for reading.

