Do You Know What Universal Corporation's (NYSE:UVV) P/E Ratio Means?

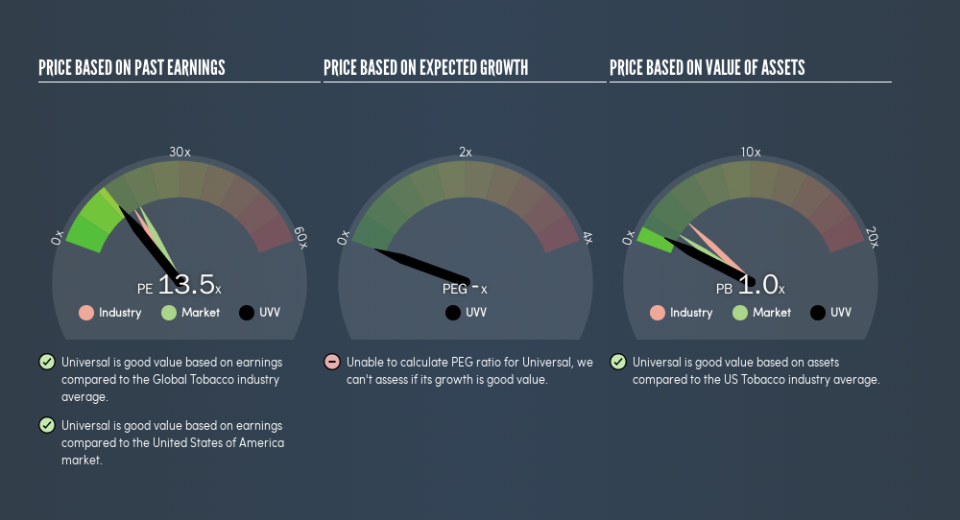
This article is for investors who would like to improve their understanding of price to earnings ratios (P/E ratios). We'll show how you can use Universal Corporation's (NYSE:UVV) P/E ratio to inform your assessment of the investment opportunity. What is Universal's P/E ratio? Well, based on the last twelve months it is 13.52. That means that at current prices, buyers pay $13.52 for every $1 in trailing yearly profits.
Check out our latest analysis for Universal
How Do You Calculate A P/E Ratio?
The formula for P/E is:
Price to Earnings Ratio = Price per Share ÷ Earnings per Share (EPS)
Or for Universal:
P/E of 13.52 = $55.59 ÷ $4.11 (Based on the year to December 2018.)
Is A High P/E Ratio Good?
A higher P/E ratio implies that investors pay a higher price for the earning power of the business. That isn't necessarily good or bad, but a high P/E implies relatively high expectations of what a company can achieve in the future.
How Growth Rates Impact P/E Ratios
P/E ratios primarily reflect market expectations around earnings growth rates. That's because companies that grow earnings per share quickly will rapidly increase the 'E' in the equation. Therefore, even if you pay a high multiple of earnings now, that multiple will become lower in the future. A lower P/E should indicate the stock is cheap relative to others -- and that may attract buyers.
Universal's 209% EPS improvement over the last year was like bamboo growth after rain; rapid and impressive. On the other hand, the longer term performance is poor, with EPS down 6.5% per year over 5 years.
Does Universal Have A Relatively High Or Low P/E For Its Industry?
We can get an indication of market expectations by looking at the P/E ratio. We can see in the image below that the average P/E (16.4) for companies in the tobacco industry is higher than Universal's P/E.
Its relatively low P/E ratio indicates that Universal shareholders think it will struggle to do as well as other companies in its industry classification. While current expectations are low, the stock could be undervalued if the situation is better than the market assumes. If you consider the stock interesting, further research is recommended. For example, I often monitor director buying and selling.
A Limitation: P/E Ratios Ignore Debt and Cash In The Bank
Don't forget that the P/E ratio considers market capitalization. Thus, the metric does not reflect cash or debt held by the company. Hypothetically, a company could reduce its future P/E ratio by spending its cash (or taking on debt) to achieve higher earnings.
Spending on growth might be good or bad a few years later, but the point is that the P/E ratio does not account for the option (or lack thereof).
Is Debt Impacting Universal's P/E?
Net debt is 26% of Universal's market cap. You'd want to be aware of this fact, but it doesn't bother us.
The Bottom Line On Universal's P/E Ratio
Universal has a P/E of 13.5. That's below the average in the US market, which is 18.2. The EPS growth last year was strong, and debt levels are quite reasonable. The low P/E ratio suggests current market expectations are muted, implying these levels of growth will not continue.
Investors have an opportunity when market expectations about a stock are wrong. If it is underestimating a company, investors can make money by buying and holding the shares until the market corrects itself. We don't have analyst forecasts, but you could get a better understanding of its growth by checking out this more detailed historical graph of earnings, revenue and cash flow.
Of course you might be able to find a better stock than Universal. So you may wish to see this free collection of other companies that have grown earnings strongly.
We aim to bring you long-term focused research analysis driven by fundamental data. Note that our analysis may not factor in the latest price-sensitive company announcements or qualitative material.
If you spot an error that warrants correction, please contact the editor at editorial-team@simplywallst.com. This article by Simply Wall St is general in nature. It does not constitute a recommendation to buy or sell any stock, and does not take account of your objectives, or your financial situation. Simply Wall St has no position in the stocks mentioned. Thank you for reading.

