Do You Know About Universal Display Corporation’s (NASDAQ:OLED) ROCE?

Want to participate in a short research study? Help shape the future of investing tools and receive a $20 prize!
Today we’ll evaluate Universal Display Corporation (NASDAQ:OLED) to determine whether it could have potential as an investment idea. To be precise, we’ll consider its Return On Capital Employed (ROCE), as that will inform our view of the quality of the business.
Firstly, we’ll go over how we calculate ROCE. Second, we’ll look at its ROCE compared to similar companies. Then we’ll determine how its current liabilities are affecting its ROCE.
Understanding Return On Capital Employed (ROCE)
ROCE is a metric for evaluating how much pre-tax income (in percentage terms) a company earns on the capital invested in its business. In general, businesses with a higher ROCE are usually better quality. Ultimately, it is a useful but imperfect metric. Renowned investment researcher Michael Mauboussin has suggested that a high ROCE can indicate that ‘one dollar invested in the company generates value of more than one dollar’.
How Do You Calculate Return On Capital Employed?
The formula for calculating the return on capital employed is:
Return on Capital Employed = Earnings Before Interest and Tax (EBIT) ÷ (Total Assets – Current Liabilities)
Or for Universal Display:
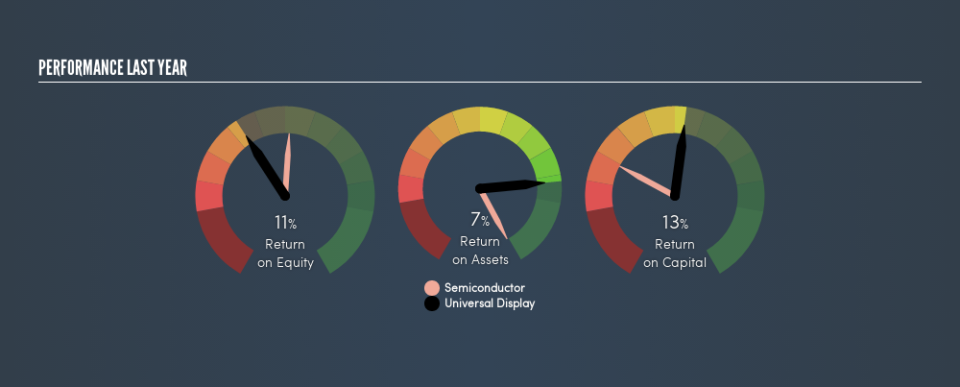
0.13 = US$146m ÷ (US$884m – US$114m) (Based on the trailing twelve months to September 2018.)
So, Universal Display has an ROCE of 13%.
Check out our latest analysis for Universal Display
Is Universal Display’s ROCE Good?
ROCE can be useful when making comparisons, such as between similar companies. Using our data, Universal Display’s ROCE appears to be around the 14% average of the Semiconductor industry. Independently of how Universal Display compares to its industry, its ROCE in absolute terms appears decent, and the company may be worthy of closer investigation.
As we can see, Universal Display currently has an ROCE of 13% compared to its ROCE 3 years ago, which was 4.6%. This makes us think about whether the company has been reinvesting shrewdly.
It is important to remember that ROCE shows past performance, and is not necessarily predictive. Companies in cyclical industries can be difficult to understand using ROCE, as returns typically look high during boom times, and low during busts. ROCE is only a point-in-time measure. Since the future is so important for investors, you should check out our free report on analyst forecasts for Universal Display.
Do Universal Display’s Current Liabilities Skew Its ROCE?
Liabilities, such as supplier bills and bank overdrafts, are referred to as current liabilities if they need to be paid within 12 months. Due to the way ROCE is calculated, a high level of current liabilities makes a company look as though it has less capital employed, and thus can (sometimes unfairly) boost the ROCE. To check the impact of this, we calculate if a company has high current liabilities relative to its total assets.
Universal Display has total assets of US$884m and current liabilities of US$114m. Therefore its current liabilities are equivalent to approximately 13% of its total assets. Low current liabilities are not boosting the ROCE too much.
The Bottom Line On Universal Display’s ROCE
This is good to see, and with a sound ROCE, Universal Display could be worth a closer look. You might be able to find a better buy than Universal Display. If you want a selection of possible winners, check out this free list of interesting companies that trade on a P/E below 20 (but have proven they can grow earnings).
If you are like me, then you will not want to miss this free list of growing companies that insiders are buying.
We aim to bring you long-term focused research analysis driven by fundamental data. Note that our analysis may not factor in the latest price-sensitive company announcements or qualitative material.
If you spot an error that warrants correction, please contact the editor at editorial-team@simplywallst.com. This article by Simply Wall St is general in nature. It does not constitute a recommendation to buy or sell any stock, and does not take account of your objectives, or your financial situation. Simply Wall St has no position in the stocks mentioned. Thank you for reading.

