Landi Renzo S.p.A. (BIT:LR) Earns A Nice Return On Capital Employed

Want to participate in a short research study? Help shape the future of investing tools and you could win a $250 gift card!
Today we'll evaluate Landi Renzo S.p.A. (BIT:LR) to determine whether it could have potential as an investment idea. In particular, we'll consider its Return On Capital Employed (ROCE), as that can give us insight into how profitably the company is able to employ capital in its business.
First up, we'll look at what ROCE is and how we calculate it. Then we'll compare its ROCE to similar companies. Then we'll determine how its current liabilities are affecting its ROCE.
Return On Capital Employed (ROCE): What is it?
ROCE measures the 'return' (pre-tax profit) a company generates from capital employed in its business. All else being equal, a better business will have a higher ROCE. Overall, it is a valuable metric that has its flaws. Author Edwin Whiting says to be careful when comparing the ROCE of different businesses, since 'No two businesses are exactly alike.'
How Do You Calculate Return On Capital Employed?
Analysts use this formula to calculate return on capital employed:
Return on Capital Employed = Earnings Before Interest and Tax (EBIT) ÷ (Total Assets - Current Liabilities)
Or for Landi Renzo:
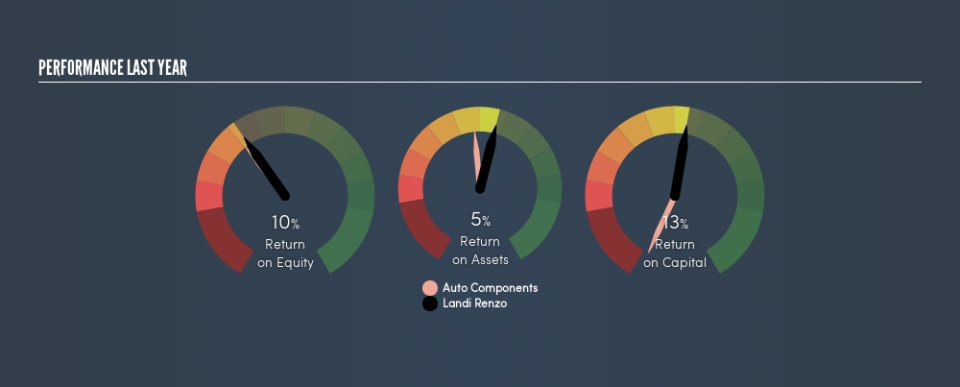
0.13 = €16m ÷ (€207m - €88m) (Based on the trailing twelve months to March 2019.)
Therefore, Landi Renzo has an ROCE of 13%.
Check out our latest analysis for Landi Renzo
Is Landi Renzo's ROCE Good?
ROCE is commonly used for comparing the performance of similar businesses. In our analysis, Landi Renzo's ROCE is meaningfully higher than the 8.8% average in the Auto Components industry. I think that's good to see, since it implies the company is better than other companies at making the most of its capital. Regardless of where Landi Renzo sits next to its industry, its ROCE in absolute terms appears satisfactory, and this company could be worth a closer look.
Landi Renzo has an ROCE of 13%, but it didn't have an ROCE 3 years ago, since it was unprofitable. That implies the business has been improving. You can see in the image below how Landi Renzo's ROCE compares to its industry. Click to see more on past growth.
It is important to remember that ROCE shows past performance, and is not necessarily predictive. ROCE can be deceptive for cyclical businesses, as returns can look incredible in boom times, and terribly low in downturns. This is because ROCE only looks at one year, instead of considering returns across a whole cycle. What happens in the future is pretty important for investors, so we have prepared a free report on analyst forecasts for Landi Renzo.
What Are Current Liabilities, And How Do They Affect Landi Renzo's ROCE?
Current liabilities include invoices, such as supplier payments, short-term debt, or a tax bill, that need to be paid within 12 months. The ROCE equation subtracts current liabilities from capital employed, so a company with a lot of current liabilities appears to have less capital employed, and a higher ROCE than otherwise. To counteract this, we check if a company has high current liabilities, relative to its total assets.
Landi Renzo has total assets of €207m and current liabilities of €88m. Therefore its current liabilities are equivalent to approximately 43% of its total assets. Landi Renzo has a middling amount of current liabilities, increasing its ROCE somewhat.
What We Can Learn From Landi Renzo's ROCE
While its ROCE looks good, it's worth remembering that the current liabilities are making the business look better. Landi Renzo shapes up well under this analysis, but it is far from the only business delivering excellent numbers . You might also want to check this free collection of companies delivering excellent earnings growth.
For those who like to find winning investments this free list of growing companies with recent insider purchasing, could be just the ticket.
We aim to bring you long-term focused research analysis driven by fundamental data. Note that our analysis may not factor in the latest price-sensitive company announcements or qualitative material.
If you spot an error that warrants correction, please contact the editor at editorial-team@simplywallst.com. This article by Simply Wall St is general in nature. It does not constitute a recommendation to buy or sell any stock, and does not take account of your objectives, or your financial situation. Simply Wall St has no position in the stocks mentioned. Thank you for reading.
