Lawmakers are redrawing Wisconsin’s legislative map. How does this computer-generated version compare to one drawn by committee?
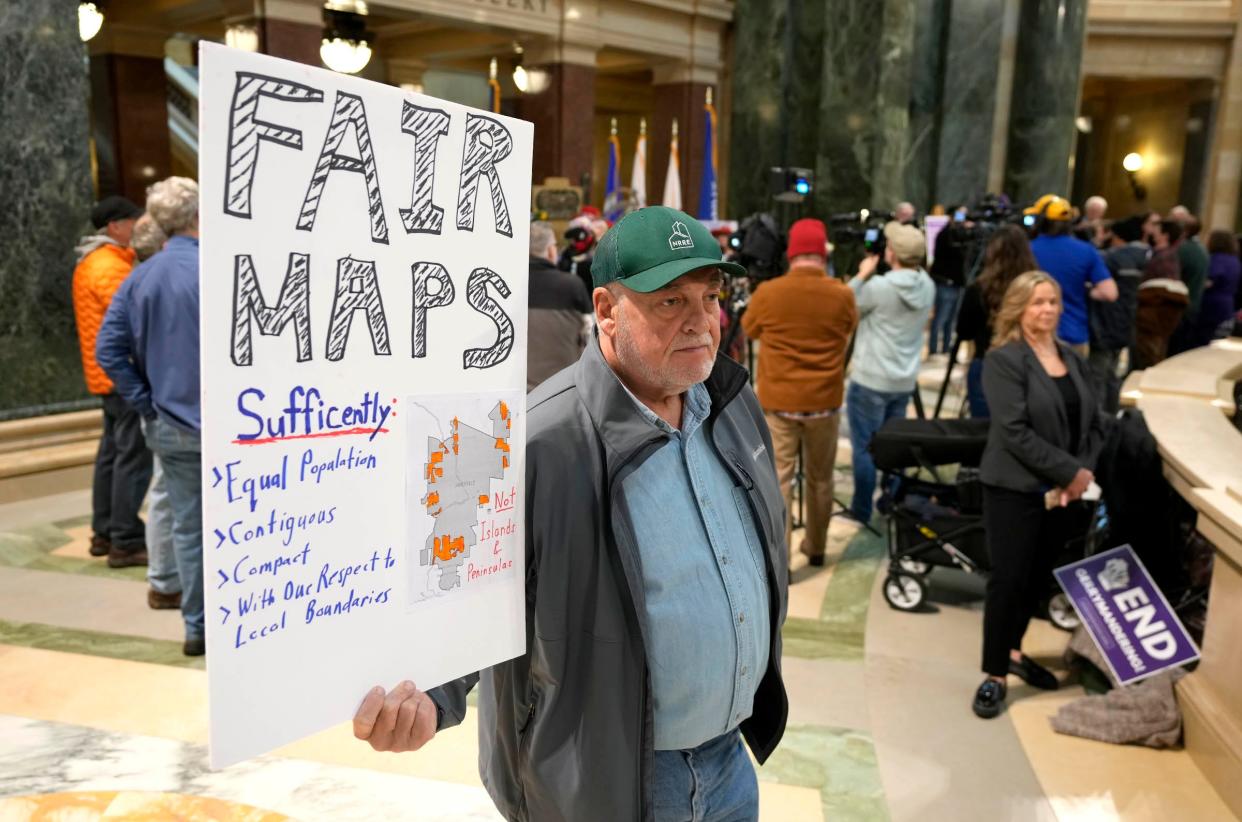
Many factors in redistricting can become causes of controversy.
Does the map give racial minorities enough representation? Will the breakdown of Democratic and Republican seats be proportional to how the state votes as a whole? Do the districts keep municipal and county boundaries intact? And are there enough swing districts so that elections aren't a foregone conclusion?
New York University data science professor Cory McCartan said redistricting is all about the trade-offs.
“All of these different criteria are not independent of one another,” McCartan said. "The reason why this is all political is how we navigate those trade-offs. In practice, it comes down to who ends up in power to draw the maps as to how those trade-offs end up happening.”
On Dec. 22, Wisconsin’s Supreme Court ordered the Republican-led state Legislature to draw new Assembly and Senate maps, ruling that it is unconstitutional for a district to be in separate, detached parts instead of a "contiguous territory."
Although there’s no way to know what new boundaries will be proposed, political researchers say some existing maps are plausible options. Many point to legislative maps drawn by the People’s Maps Commission, a nine-member, nonpartisan committee created under Democratic Gov. Tony Evers.
Computer algorithm-generated maps have also gained recognition in recent years as potential tools that can limit human bias or optimize certain criteria. University of Wisconsin-Milwaukee professor Matthew Petering has previously submitted a map generated by his software FastMap to the Wisconsin Supreme Court.
Analysis by the Milwaukee Journal Sentinel shows that both proposed maps are more proportional to how the state of Wisconsin votes as a whole than the current boundaries.
The two example maps also produce more competitive districts.
Although the final boundaries are likely to look very different than either map, the Journal Sentinel analysis is meant to illustrate the often arbitrary ways that lines can be drawn and how easily they can change the balance of power in the state.
The state Assembly maps
As a swing state, Wisconsin votes are generally evenly split between Democrats and Republicans. But Republicans hold majorities in both the state Assembly and state Senate.
In the state Assembly, Republicans hold 64 of 99 seats. Based how Wisconsinites voted in statewide and national elections from 2016 to 2020, 55 are Republican strongholds. Only 35 districts are Democratic strongholds. The other nine seats are somewhat competitive.
Compared to the current boundaries, the two proposed maps both make the Assembly more proportional to how the state votes as a whole.
The People’s Maps Commission map creates 46 districts with a Republican stronghold and 39 districts with a Democratic stronghold.
The Assembly map generated by FastMap is even more balanced, creating 42 districts with a Republican stronghold and 45 with a Democratic stronghold.
In addition, the map drawn by the People’s Maps Commission gives Wisconsin 14 competitive districts, with seven that are highly competitive. This is about double the number of highly competitive districts in the current map or the map generated by FastMap.
The state Senate maps
In the state Senate, Republicans currently have a supermajority, holding 22 of 33 seats. Nineteen districts are Republican strongholds while 10 districts are Democratic strongholds. Only four are a toss-up.
The People’s Commission map, in comparison, has 17 Republican stronghold districts and 10 Democratic stronghold districts. It leaves six districts that are competitive.
Meanwhile, FastMap creates 13 districts where Republicans have a stronghold. That leaves 14 districts where Democrats have a stronghold and six competitive districts.
How can maps drawn with the same set of guidelines become so different?
Political researchers often explain how gerrymandering works through the terms “cracking" and "packing.”
Depending on how maps are drawn, tight-knit communities can be separated into different districts. This is a practice sometimes called cracking.
Experts say examples of cracking can be found in Sheboygan, Waukesha, Beloit, Whitewater and Greenwood in the state Assembly and in Brown Deer and Bayside in the state Senate.
Take Sheboygan as an example. The current state Assembly map splits Democratic-leaning areas of Sheboygan into two and combines them with other areas that lean more Republican.
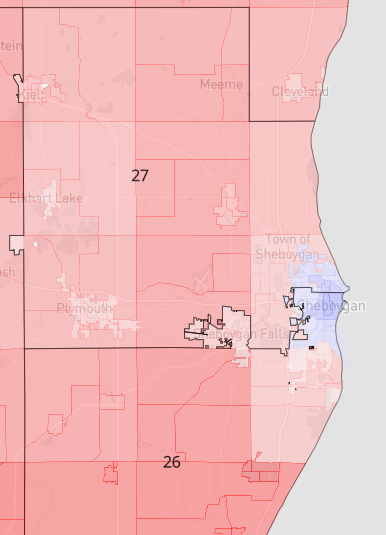
As a result of the split, Sheboygan city residents play no deciding role in either of the two districts, which both lean heavily Republican.
On the other hand, larger communities with a strong preference for one party can be concentrated into one district instead of spread across two. This type of gerrymandering is called packing, and allows mapmakers to ensure that there is less competition for their party in neighboring districts.
It is often difficult to determine whether packing is intentional, according to Marquette University public policy research fellow John Johnson. It is often conflated with respecting municipal and county boundaries, which can cause districts that adhere to this rule to have irregular shapes.
The history of Assembly redistricting in the Wauwatosa area can offer some insights into both cracking and packing.
In 2011, the Democratic-leaning city of Wauwatosa was "cracked" into three different districts: District 13, 14 and 15. The redistricting split the city into three districts that also spanned across Milwaukee County and Waukesha County.
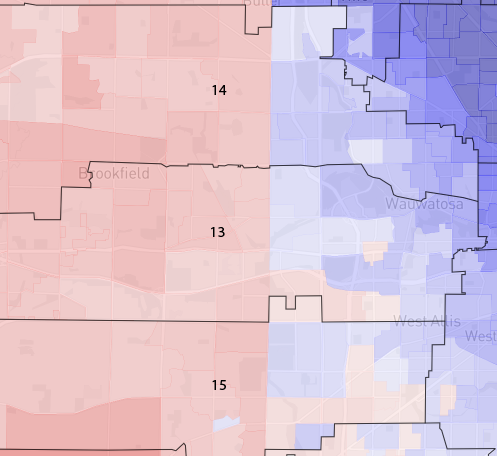
As a result, Democrats became the minority in all three districts in 2012.
In recent years, suburban parts of all three districts began to lean Democratic. In 2020, District 13 and District 14 were both won by Democrats by a small margin.
When it came time for the Republican-led state legislature to redraw the districts again in 2021, the body "packed" all of Wauwatosa into the same district — the current Assembly District 14.
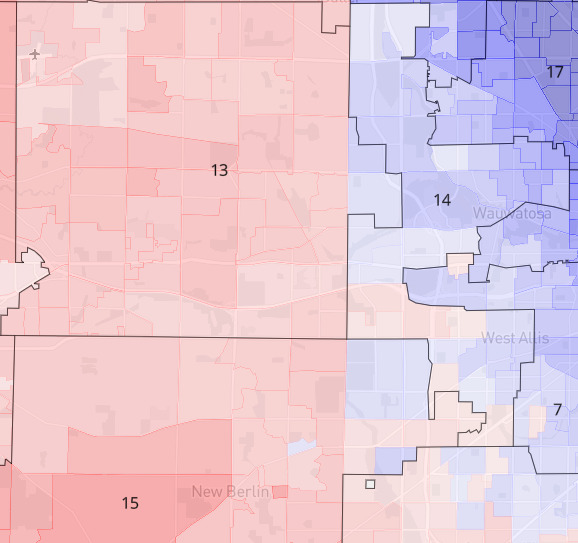
This left one of the three districts blue, but it also ensured the other two districts - District 13 and 15 - would both lean heavily Republican, preserving two Republican seats.
Do Republicans have a built-in advantage due to geography?
For Petering, one of the biggest priorities in generating his maps was to ensure the share of Republican and Democratic lawmakers reflected the share of Republican and Democratic voters in the state.
"When we think about representation, you're looking at the big pool of Wisconsin voters," Petering said. "And you're looking at having a smaller body of people, like our state legislature, that represents them. The idea of representation, at least to me, almost means proportionality."
That being said, Republicans have some natural geographical advantages when it comes to redistricting. While Democrats are more clustered in cities, Republicans tend to be spread out over the state.
"You can do a random process generating maps without the election data," Petering said. "The blue voters will end up being concentrated into fewer districts, carrying those overwhelmingly. The red voters will tend to be spread out across more districts, winning those narrowly."
However, research by many political scientists shows this natural GOP advantage in Wisconsin is not as large as the current map currently gives them.
Petering, for example, tested this by randomly simulating more 1,000 Assembly maps using Fastmap, without inputting any data about political leanings. On average, Democrats were still predicted to win around 43 seats and Republicans around 56 — nine fewer than they currently hold.
Today, many political science experts agree that Wisconsin’s heavily gerrymandered districts have given the GOP a majority of the state seats since 2011.
“All of the usual indicators we use to look at in gerrymandering indicate that the Wisconsin state legislature map is one of the most gerrymandered in the country and in recent political history,” McCartan said. “It’s pretty egregious in terms of the way in which generating more Republican districts was the number one priority and all of the other criteria fell way down the list in terms of how much they were considered.”
What's next?
New map proposals are expected to be filed to the courts by Friday. Wisconsin Elections Commission officials have said the maps must be in place by March 15, in time for the August legislative primary.
Editor's note, Jan. 9: Due to an editing error, this story was updated to clarify the state Supreme Court's ruling.
This article originally appeared on Milwaukee Journal Sentinel: Computer or committee? Comparing proposed Wisconsin redistricting maps

