What Can We Learn From Hi Sun Technology (China) Limited’s (HKG:818) Investment Returns?

Today we'll evaluate Hi Sun Technology (China) Limited (HKG:818) to determine whether it could have potential as an investment idea. Specifically, we're going to calculate its Return On Capital Employed (ROCE), in the hopes of getting some insight into the business.
Firstly, we'll go over how we calculate ROCE. Next, we'll compare it to others in its industry. Finally, we'll look at how its current liabilities affect its ROCE.
Understanding Return On Capital Employed (ROCE)
ROCE is a metric for evaluating how much pre-tax income (in percentage terms) a company earns on the capital invested in its business. All else being equal, a better business will have a higher ROCE. Ultimately, it is a useful but imperfect metric. Renowned investment researcher Michael Mauboussin has suggested that a high ROCE can indicate that 'one dollar invested in the company generates value of more than one dollar'.
So, How Do We Calculate ROCE?
The formula for calculating the return on capital employed is:
Return on Capital Employed = Earnings Before Interest and Tax (EBIT) ÷ (Total Assets - Current Liabilities)
Or for Hi Sun Technology (China):
0.12 = HK$599m ÷ (HK$7.3b - HK$2.4b) (Based on the trailing twelve months to June 2019.)
Therefore, Hi Sun Technology (China) has an ROCE of 12%.
See our latest analysis for Hi Sun Technology (China)
Is Hi Sun Technology (China)'s ROCE Good?
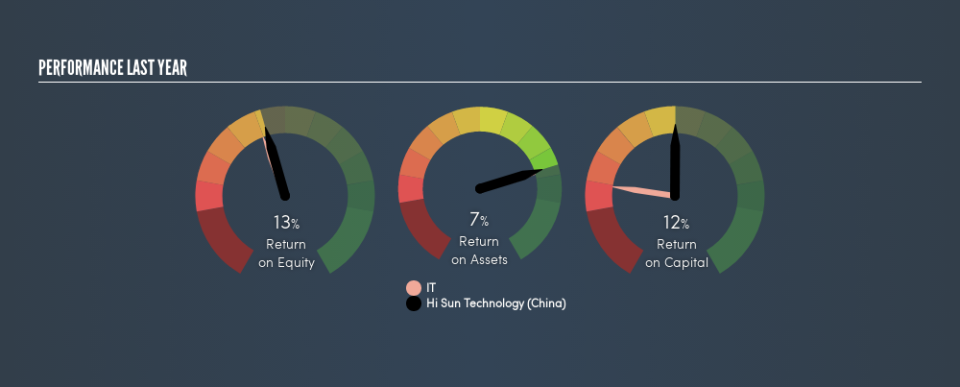
One way to assess ROCE is to compare similar companies. We can see Hi Sun Technology (China)'s ROCE is around the 12% average reported by the IT industry. Independently of how Hi Sun Technology (China) compares to its industry, its ROCE in absolute terms appears decent, and the company may be worthy of closer investigation.
In our analysis, Hi Sun Technology (China)'s ROCE appears to be 12%, compared to 3 years ago, when its ROCE was 2.2%. This makes us think the business might be improving. You can see in the image below how Hi Sun Technology (China)'s ROCE compares to its industry. Click to see more on past growth.
When considering this metric, keep in mind that it is backwards looking, and not necessarily predictive. ROCE can be misleading for companies in cyclical industries, with returns looking impressive during the boom times, but very weak during the busts. ROCE is, after all, simply a snap shot of a single year. Future performance is what matters, and you can see analyst predictions in our free report on analyst forecasts for the company.
How Hi Sun Technology (China)'s Current Liabilities Impact Its ROCE
Liabilities, such as supplier bills and bank overdrafts, are referred to as current liabilities if they need to be paid within 12 months. The ROCE equation subtracts current liabilities from capital employed, so a company with a lot of current liabilities appears to have less capital employed, and a higher ROCE than otherwise. To counteract this, we check if a company has high current liabilities, relative to its total assets.
Hi Sun Technology (China) has total liabilities of HK$2.4b and total assets of HK$7.3b. As a result, its current liabilities are equal to approximately 32% of its total assets. Hi Sun Technology (China) has a middling amount of current liabilities, increasing its ROCE somewhat.
The Bottom Line On Hi Sun Technology (China)'s ROCE
With a decent ROCE, the company could be interesting, but remember that the level of current liabilities make the ROCE look better. Hi Sun Technology (China) shapes up well under this analysis, but it is far from the only business delivering excellent numbers . You might also want to check this free collection of companies delivering excellent earnings growth.
If you are like me, then you will not want to miss this free list of growing companies that insiders are buying.
We aim to bring you long-term focused research analysis driven by fundamental data. Note that our analysis may not factor in the latest price-sensitive company announcements or qualitative material.
If you spot an error that warrants correction, please contact the editor at editorial-team@simplywallst.com. This article by Simply Wall St is general in nature. It does not constitute a recommendation to buy or sell any stock, and does not take account of your objectives, or your financial situation. Simply Wall St has no position in the stocks mentioned. Thank you for reading.

