Leyou Technologies Holdings Limited (HKG:1089) Earns Among The Best Returns In Its Industry

Want to participate in a short research study? Help shape the future of investing tools and you could win a $250 gift card!
Today we'll evaluate Leyou Technologies Holdings Limited (HKG:1089) to determine whether it could have potential as an investment idea. Specifically, we'll consider its Return On Capital Employed (ROCE), since that will give us an insight into how efficiently the business can generate profits from the capital it requires.
First of all, we'll work out how to calculate ROCE. Next, we'll compare it to others in its industry. Finally, we'll look at how its current liabilities affect its ROCE.
Understanding Return On Capital Employed (ROCE)
ROCE is a metric for evaluating how much pre-tax income (in percentage terms) a company earns on the capital invested in its business. In general, businesses with a higher ROCE are usually better quality. In brief, it is a useful tool, but it is not without drawbacks. Renowned investment researcher Michael Mauboussin has suggested that a high ROCE can indicate that 'one dollar invested in the company generates value of more than one dollar'.
So, How Do We Calculate ROCE?
The formula for calculating the return on capital employed is:
Return on Capital Employed = Earnings Before Interest and Tax (EBIT) ÷ (Total Assets - Current Liabilities)
Or for Leyou Technologies Holdings:
0.32 = US$76m ÷ (US$311m - US$70m) (Based on the trailing twelve months to December 2018.)
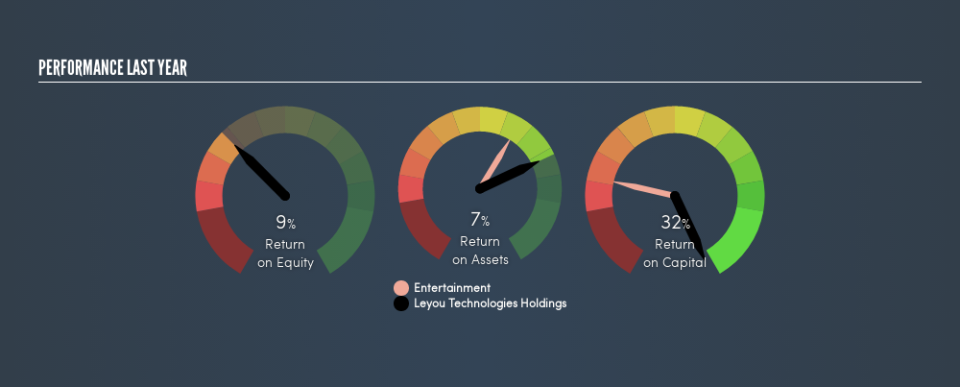
So, Leyou Technologies Holdings has an ROCE of 32%.
View our latest analysis for Leyou Technologies Holdings
Is Leyou Technologies Holdings's ROCE Good?
ROCE can be useful when making comparisons, such as between similar companies. In our analysis, Leyou Technologies Holdings's ROCE is meaningfully higher than the 11% average in the Entertainment industry. We consider this a positive sign, because it suggests it uses capital more efficiently than similar companies. Putting aside its position relative to its industry for now, in absolute terms, Leyou Technologies Holdings's ROCE is currently very good.
Our data shows that Leyou Technologies Holdings currently has an ROCE of 32%, compared to its ROCE of 2.8% 3 years ago. This makes us wonder if the company is improving.
When considering this metric, keep in mind that it is backwards looking, and not necessarily predictive. ROCE can be deceptive for cyclical businesses, as returns can look incredible in boom times, and terribly low in downturns. ROCE is only a point-in-time measure. You can check if Leyou Technologies Holdings has cyclical profits by looking at this free graph of past earnings, revenue and cash flow.
What Are Current Liabilities, And How Do They Affect Leyou Technologies Holdings's ROCE?
Liabilities, such as supplier bills and bank overdrafts, are referred to as current liabilities if they need to be paid within 12 months. The ROCE equation subtracts current liabilities from capital employed, so a company with a lot of current liabilities appears to have less capital employed, and a higher ROCE than otherwise. To check the impact of this, we calculate if a company has high current liabilities relative to its total assets.
Leyou Technologies Holdings has total liabilities of US$70m and total assets of US$311m. As a result, its current liabilities are equal to approximately 23% of its total assets. A minimal amount of current liabilities limits the impact on ROCE.
What We Can Learn From Leyou Technologies Holdings's ROCE
With low current liabilities and a high ROCE, Leyou Technologies Holdings could be worthy of further investigation. Leyou Technologies Holdings shapes up well under this analysis, but it is far from the only business delivering excellent numbers . You might also want to check this free collection of companies delivering excellent earnings growth.
If you are like me, then you will not want to miss this free list of growing companies that insiders are buying.
We aim to bring you long-term focused research analysis driven by fundamental data. Note that our analysis may not factor in the latest price-sensitive company announcements or qualitative material.
If you spot an error that warrants correction, please contact the editor at editorial-team@simplywallst.com. This article by Simply Wall St is general in nature. It does not constitute a recommendation to buy or sell any stock, and does not take account of your objectives, or your financial situation. Simply Wall St has no position in the stocks mentioned. Thank you for reading.
