What Is LKS Holding Group's (HKG:1867) P/E Ratio After Its Share Price Rocketed?

LKS Holding Group (HKG:1867) shareholders are no doubt pleased to see that the share price has bounced 40% in the last month alone, although it is still down 16% over the last quarter. But shareholders may not all be feeling jubilant, since the share price is still down 19% in the last year.
Assuming no other changes, a sharply higher share price makes a stock less attractive to potential buyers. While the market sentiment towards a stock is very changeable, in the long run, the share price will tend to move in the same direction as earnings per share. The implication here is that deep value investors might steer clear when expectations of a company are too high. One way to gauge market expectations of a stock is to look at its Price to Earnings Ratio (PE Ratio). A high P/E implies that investors have high expectations of what a company can achieve compared to a company with a low P/E ratio.
See our latest analysis for LKS Holding Group
Does LKS Holding Group Have A Relatively High Or Low P/E For Its Industry?
LKS Holding Group has a P/E ratio of 12.78. You can see in the image below that the average P/E (13.6) for companies in the commercial services industry is roughly the same as LKS Holding Group's P/E.
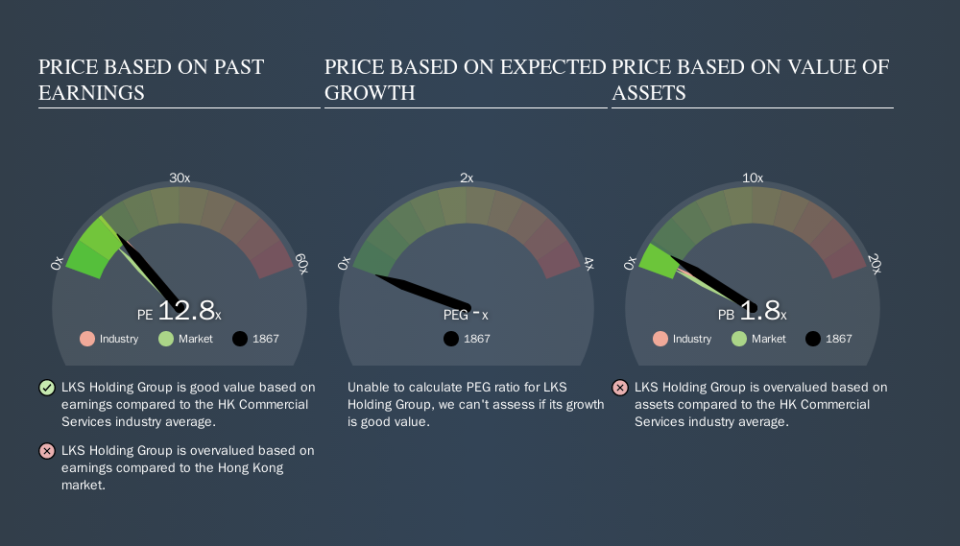
That indicates that the market expects LKS Holding Group will perform roughly in line with other companies in its industry. So if LKS Holding Group actually outperforms its peers going forward, that should be a positive for the share price. Checking factors such as director buying and selling. could help you form your own view on if that will happen.
How Growth Rates Impact P/E Ratios
Earnings growth rates have a big influence on P/E ratios. Earnings growth means that in the future the 'E' will be higher. That means unless the share price increases, the P/E will reduce in a few years. And as that P/E ratio drops, the company will look cheap, unless its share price increases.
LKS Holding Group saw earnings per share decrease by 26% last year. But it has grown its earnings per share by 2.7% per year over the last five years.
A Limitation: P/E Ratios Ignore Debt and Cash In The Bank
Don't forget that the P/E ratio considers market capitalization. That means it doesn't take debt or cash into account. In theory, a company can lower its future P/E ratio by using cash or debt to invest in growth.
Such expenditure might be good or bad, in the long term, but the point here is that the balance sheet is not reflected by this ratio.
LKS Holding Group's Balance Sheet
The extra options and safety that comes with LKS Holding Group's HK$7.5m net cash position means that it deserves a higher P/E than it would if it had a lot of net debt.
The Verdict On LKS Holding Group's P/E Ratio
LKS Holding Group trades on a P/E ratio of 12.8, which is above its market average of 10.5. The recent drop in earnings per share would make some investors cautious, but the relatively strong balance sheet will allow the company time to invest in growth. Clearly, the high P/E indicates shareholders think it will! What is very clear is that the market has become more optimistic about LKS Holding Group over the last month, with the P/E ratio rising from 9.1 back then to 12.8 today. For those who prefer to invest with the flow of momentum, that might mean it's time to put the stock on a watchlist, or research it. But the contrarian may see it as a missed opportunity.
Investors have an opportunity when market expectations about a stock are wrong. People often underestimate remarkable growth -- so investors can make money when fast growth is not fully appreciated. We don't have analyst forecasts, but you could get a better understanding of its growth by checking out this more detailed historical graph of earnings, revenue and cash flow.
Of course you might be able to find a better stock than LKS Holding Group. So you may wish to see this free collection of other companies that have grown earnings strongly.
We aim to bring you long-term focused research analysis driven by fundamental data. Note that our analysis may not factor in the latest price-sensitive company announcements or qualitative material.
If you spot an error that warrants correction, please contact the editor at editorial-team@simplywallst.com. This article by Simply Wall St is general in nature. It does not constitute a recommendation to buy or sell any stock, and does not take account of your objectives, or your financial situation. Simply Wall St has no position in the stocks mentioned. Thank you for reading.

