Is Lundin Mining Corporation’s (TSE:LUN) 5.4% ROCE Any Good?

Today we’ll evaluate Lundin Mining Corporation (TSE:LUN) to determine whether it could have potential as an investment idea. To be precise, we’ll consider its Return On Capital Employed (ROCE), as that will inform our view of the quality of the business.
First of all, we’ll work out how to calculate ROCE. Next, we’ll compare it to others in its industry. Finally, we’ll look at how its current liabilities affect its ROCE.
Return On Capital Employed (ROCE): What is it?
ROCE measures the ‘return’ (pre-tax profit) a company generates from capital employed in its business. All else being equal, a better business will have a higher ROCE. Overall, it is a valuable metric that has its flaws. Author Edwin Whiting says to be careful when comparing the ROCE of different businesses, since ‘No two businesses are exactly alike.’
How Do You Calculate Return On Capital Employed?
Analysts use this formula to calculate return on capital employed:
Return on Capital Employed = Earnings Before Interest and Tax (EBIT) ÷ (Total Assets – Current Liabilities)
Or for Lundin Mining:
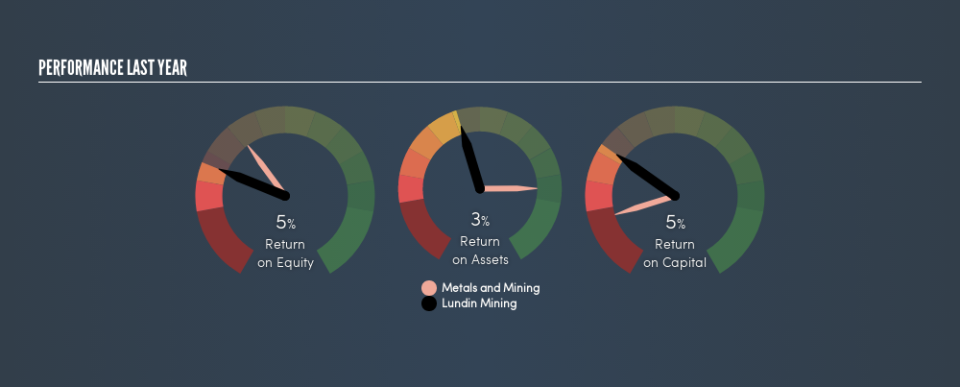
0.054 = US$296m ÷ (US$5.9b – US$495m) (Based on the trailing twelve months to December 2018.)
Therefore, Lundin Mining has an ROCE of 5.4%.
View our latest analysis for Lundin Mining
Want to participate in a research study? Help shape the future of investing tools and earn a $60 gift card!
Does Lundin Mining Have A Good ROCE?
ROCE can be useful when making comparisons, such as between similar companies. In our analysis, Lundin Mining’s ROCE is meaningfully higher than the 2.3% average in the Metals and Mining industry. We consider this a positive sign, because it suggests it uses capital more efficiently than similar companies. Separate from how Lundin Mining stacks up against its industry, its ROCE in absolute terms is mediocre; relative to the returns on government bonds. Investors may wish to consider higher-performing investments.
Lundin Mining delivered an ROCE of 5.4%, which is better than 3 years ago, as was making losses back then. This makes us wonder if the company is improving.
When considering this metric, keep in mind that it is backwards looking, and not necessarily predictive. Companies in cyclical industries can be difficult to understand using ROCE, as returns typically look high during boom times, and low during busts. ROCE is, after all, simply a snap shot of a single year. We note Lundin Mining could be considered a cyclical business. What happens in the future is pretty important for investors, so we have prepared a free report on analyst forecasts for Lundin Mining.
Lundin Mining’s Current Liabilities And Their Impact On Its ROCE
Liabilities, such as supplier bills and bank overdrafts, are referred to as current liabilities if they need to be paid within 12 months. The ROCE equation subtracts current liabilities from capital employed, so a company with a lot of current liabilities appears to have less capital employed, and a higher ROCE than otherwise. To counter this, investors can check if a company has high current liabilities relative to total assets.
Lundin Mining has total liabilities of US$495m and total assets of US$5.9b. Therefore its current liabilities are equivalent to approximately 8.3% of its total assets. Lundin Mining has a low level of current liabilities, which have a minimal impact on its uninspiring ROCE.
The Bottom Line On Lundin Mining’s ROCE
Lundin Mining looks like an ok business, but on this analysis it is not at the top of our buy list. Of course, you might find a fantastic investment by looking at a few good candidates. So take a peek at this free list of companies with modest (or no) debt, trading on a P/E below 20.
If you are like me, then you will not want to miss this free list of growing companies that insiders are buying.
We aim to bring you long-term focused research analysis driven by fundamental data. Note that our analysis may not factor in the latest price-sensitive company announcements or qualitative material.
If you spot an error that warrants correction, please contact the editor at editorial-team@simplywallst.com. This article by Simply Wall St is general in nature. It does not constitute a recommendation to buy or sell any stock, and does not take account of your objectives, or your financial situation. Simply Wall St has no position in the stocks mentioned. Thank you for reading.

