Is Møns Bank A/S's (CPH:MNBA) P/E Ratio Really That Good?

This article is for investors who would like to improve their understanding of price to earnings ratios (P/E ratios). We'll show how you can use Møns Bank A/S's (CPH:MNBA) P/E ratio to inform your assessment of the investment opportunity. Looking at earnings over the last twelve months, Møns Bank has a P/E ratio of 7.41. That means that at current prices, buyers pay DKK7.41 for every DKK1 in trailing yearly profits.
Want to participate in a short research study? Help shape the future of investing tools and you could win a $250 gift card!
Check out our latest analysis for Møns Bank
How Do You Calculate A P/E Ratio?
The formula for P/E is:
Price to Earnings Ratio = Share Price ÷ Earnings per Share (EPS)
Or for Møns Bank:
P/E of 7.41 = DKK123 ÷ DKK16.6 (Based on the year to December 2018.)
Is A High Price-to-Earnings Ratio Good?
A higher P/E ratio means that investors are paying a higher price for each DKK1 of company earnings. That isn't necessarily good or bad, but a high P/E implies relatively high expectations of what a company can achieve in the future.
How Growth Rates Impact P/E Ratios
When earnings fall, the 'E' decreases, over time. That means even if the current P/E is low, it will increase over time if the share price stays flat. A higher P/E should indicate the stock is expensive relative to others -- and that may encourage shareholders to sell.
Møns Bank's earnings per share fell by 32% in the last twelve months. And it has shrunk its earnings per share by 2.3% per year over the last three years. This could justify a low P/E.
How Does Møns Bank's P/E Ratio Compare To Its Peers?
The P/E ratio indicates whether the market has higher or lower expectations of a company. You can see in the image below that the average P/E (7.9) for companies in the banks industry is roughly the same as Møns Bank's P/E.
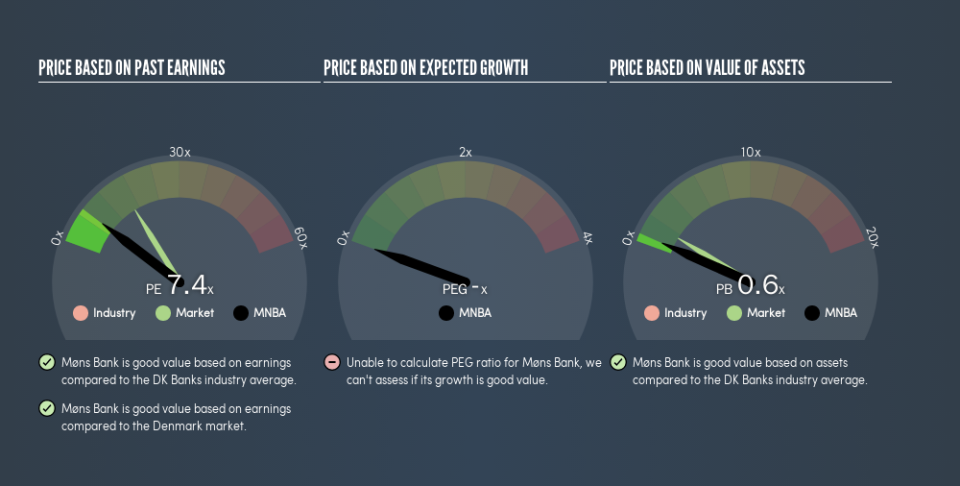
Its P/E ratio suggests that Møns Bank shareholders think that in the future it will perform about the same as other companies in its industry classification. So if Møns Bank actually outperforms its peers going forward, that should be a positive for the share price. Checking factors such as the tenure of the board and management could help you form your own view on if that will happen.
Remember: P/E Ratios Don't Consider The Balance Sheet
The 'Price' in P/E reflects the market capitalization of the company. In other words, it does not consider any debt or cash that the company may have on the balance sheet. In theory, a company can lower its future P/E ratio by using cash or debt to invest in growth.
Spending on growth might be good or bad a few years later, but the point is that the P/E ratio does not account for the option (or lack thereof).
Møns Bank's Balance Sheet
Møns Bank's net debt is 8.4% of its market cap. It would probably trade on a higher P/E ratio if it had a lot of cash, but I doubt it is having a big impact.
The Verdict On Møns Bank's P/E Ratio
Møns Bank trades on a P/E ratio of 7.4, which is below the DK market average of 16.8. With only modest debt, it's likely the lack of EPS growth at least partially explains the pessimism implied by the P/E ratio.
When the market is wrong about a stock, it gives savvy investors an opportunity. As value investor Benjamin Graham famously said, 'In the short run, the market is a voting machine but in the long run, it is a weighing machine.' We don't have analyst forecasts, but shareholders might want to examine this detailed historical graph of earnings, revenue and cash flow.
Of course, you might find a fantastic investment by looking at a few good candidates. So take a peek at this free list of companies with modest (or no) debt, trading on a P/E below 20.
We aim to bring you long-term focused research analysis driven by fundamental data. Note that our analysis may not factor in the latest price-sensitive company announcements or qualitative material.
If you spot an error that warrants correction, please contact the editor at editorial-team@simplywallst.com. This article by Simply Wall St is general in nature. It does not constitute a recommendation to buy or sell any stock, and does not take account of your objectives, or your financial situation. Simply Wall St has no position in the stocks mentioned. Thank you for reading.
